Visualizes the combined effect of two variables from a "mid" object using a 3D perspective plot.
Usage
# S3 method for class 'mid'
persp(object, xvar, yvar = NULL, ..., xval = NULL, yval = NULL)
Arguments
- object
a "mid" object, typically the result of
midr::interpret().- xvar
a character string with the name of the variable for the x-axis. Alternatively, a single string in the format
xvar:yvarcan be provided, in which caseyvarcan be omitted.- yvar
a character string with the name of the variable for the y-axis.
- ...
additional arguments passed on to
graphics:::persp.default(). Used to customize the plot's appearance, such as view angles (theta,phi) or color (col).- xval
a numeric or character vector specifying the sequence of values for the x-axis.
- yval
a numeric or character vector specifying the sequence of values for the y-axis.
Value
persp.mid() invisibly returns the viewing transformation matrix, see persp for details.
This function is primarily called for its side effect of creating a plot.
Details
This is an S3 method for the persp() generic that calculates the sum of the main effects of xvar and yvar and their interaction effect (xvar:yvar).
The resulting sum is plotted as the height on the z-axis.
Examples
mid <- midr::interpret(mpg ~ wt * hp + factor(am), data = mtcars, lambda = .5)
#> 'model' not passed: response variable in 'data' is used
# Create a basic perspective plot
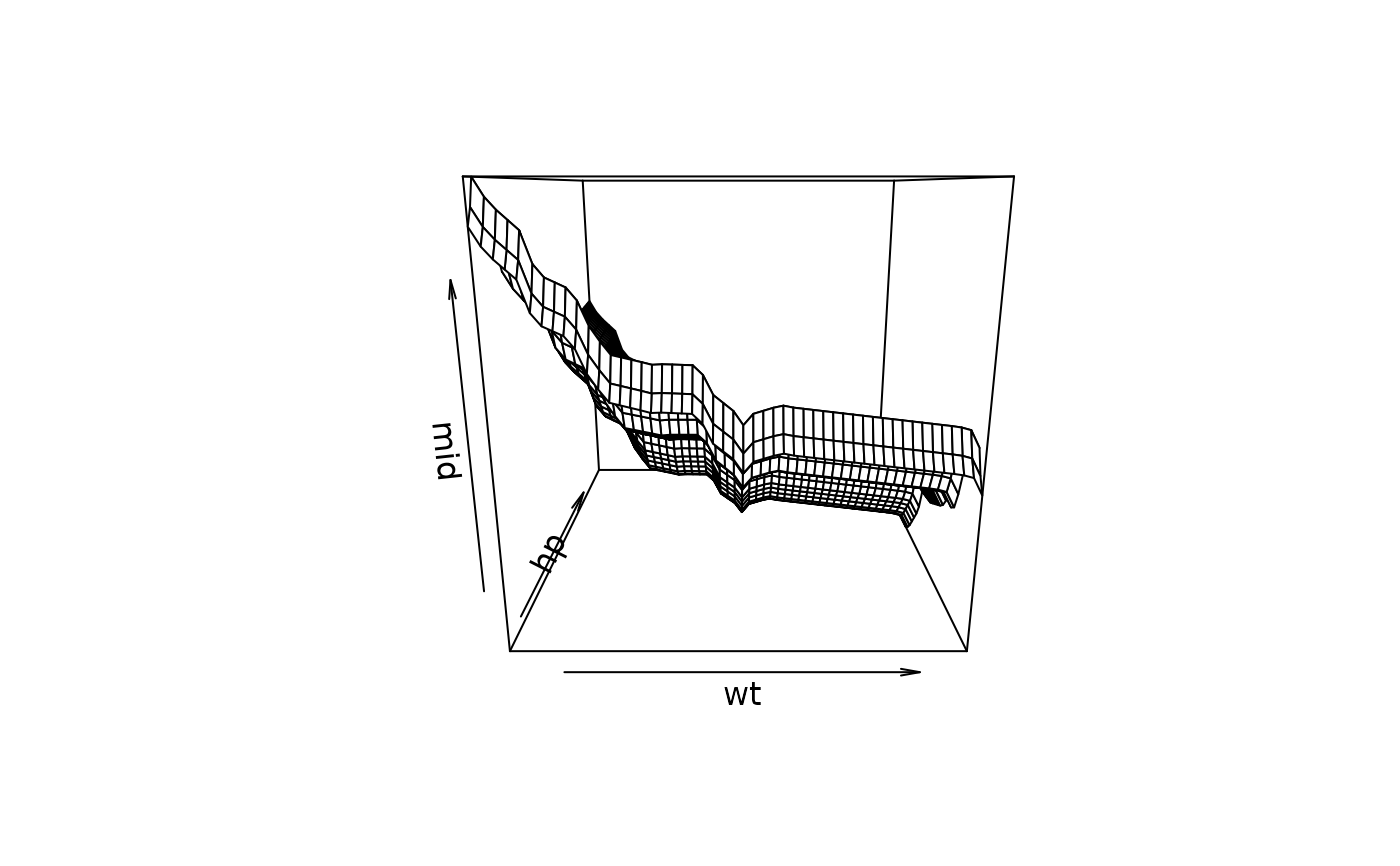
persp(mid, xvar = "wt", yvar = "hp")
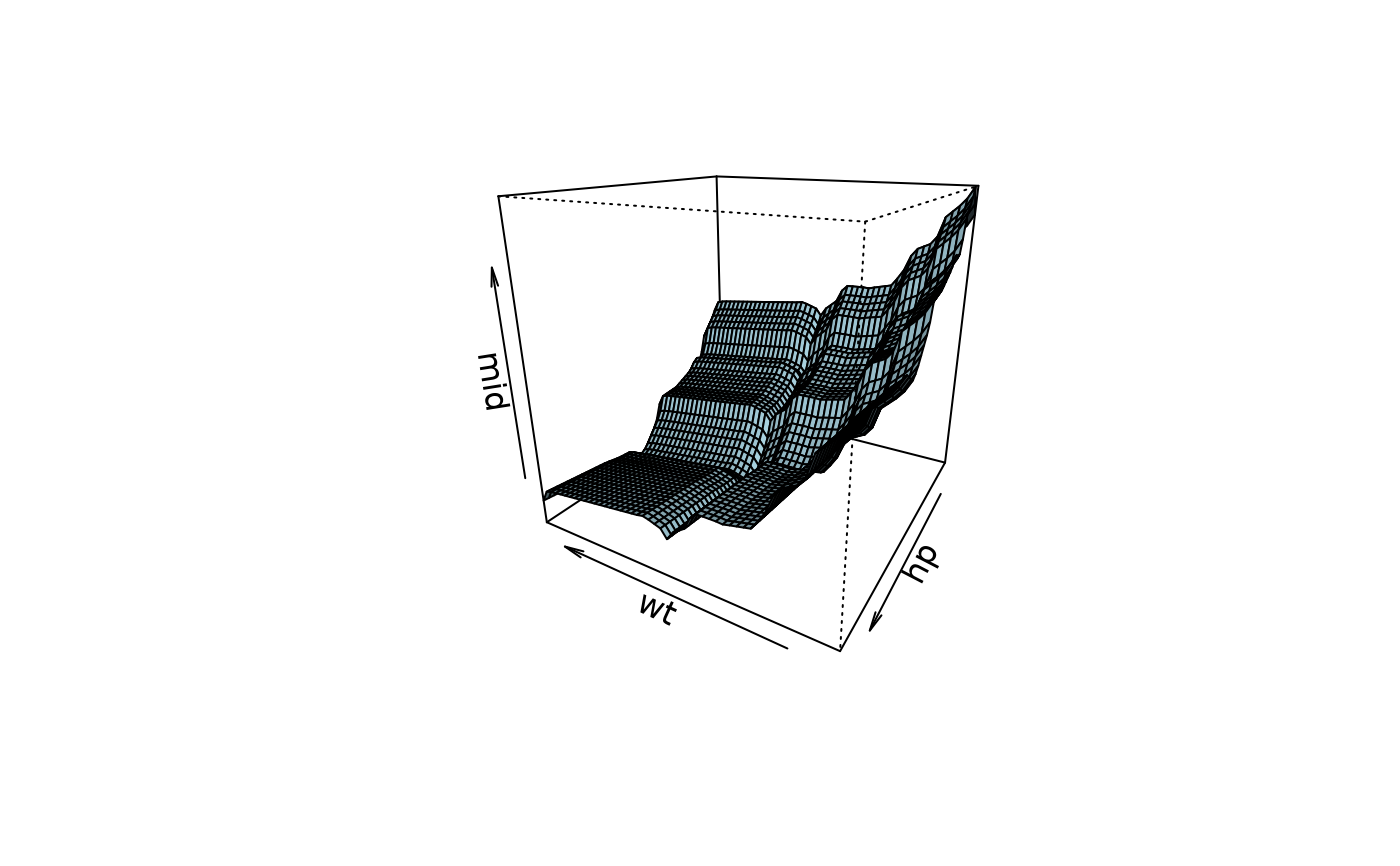
 # Customize the plot by passing arguments to graphics:::persp.default()
persp(mid, "wt", "hp", theta = 210, phi = 20, col = "lightblue", shade = .5)
# Customize the plot by passing arguments to graphics:::persp.default()
persp(mid, "wt", "hp", theta = 210, phi = 20, col = "lightblue", shade = .5)
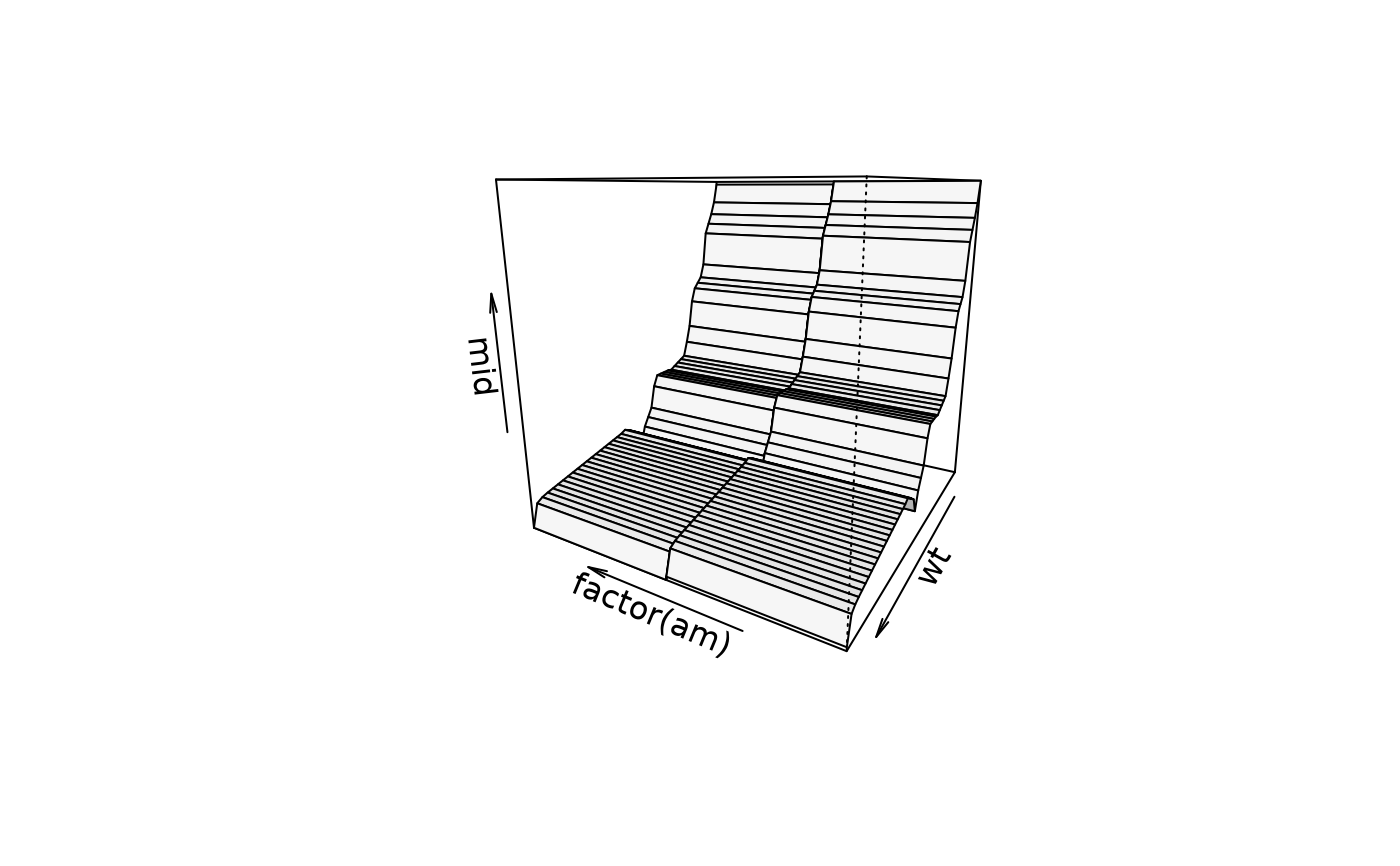
 persp(mid, "factor(am):wt", theta = 210, shade = .2)