scale_color_theme() and its family of functions provide a unified interface to apply custom color themes to the colour and fill aesthetics of "ggplot" objects.
Usage
scale_color_theme(
  theme,
  ...,
  discrete = NULL,
  middle = 0,
  aesthetics = "colour"
)

scale_colour_theme(
  theme,
  ...,
  discrete = NULL,
  middle = 0,
  aesthetics = "colour"
)

scale_fill_theme(theme, ..., discrete = NULL, middle = 0, aesthetics = "fill")
Arguments
- theme
a color theme name (e.g., "Viridis"), a character vector of color names, or a palette/ramp function. See
?color.themefor more details.- ...
optional arguments to be passed to
ggplot2::continuous_scale()orggplot2::discrete_scale().- discrete
logical. If
TRUE, a discrete scale is used regardless of the theme type.- middle
a numeric value specifying the middle point for the diverging color themes.
- aesthetics
the aesthetic to be scaled. Can be "colour", "color", or "fill".
Value
scale_color_theme() returns a ggplot2 scale object (either a "ScaleContinuous" or "ScaleDiscrete" object) that can be added to a "ggplot" object.
Details
This function automatically determines the appropriate ggplot2 scale based on the theme's type.
If the theme is "qualitative", a discrete scale is used by default to assign distinct colors to categorical data.
The discrete argument is automatically set to TRUE if not specified.
If the theme is "sequential" or "diverging", a continuous scale is used by default.
The "diverging" themes are handled by scales::rescale_mid() to correctly center the gradient around the middle value.
Examples
data(txhousing, package = "ggplot2")
cities <- c("Houston", "Fort Worth", "San Antonio", "Dallas", "Austin")
df <- subset(txhousing, city %in% cities)
d <- ggplot2::ggplot(data = df, ggplot2::aes(x = sales, y = median)) +
ggplot2::geom_point(ggplot2::aes(colour = city))
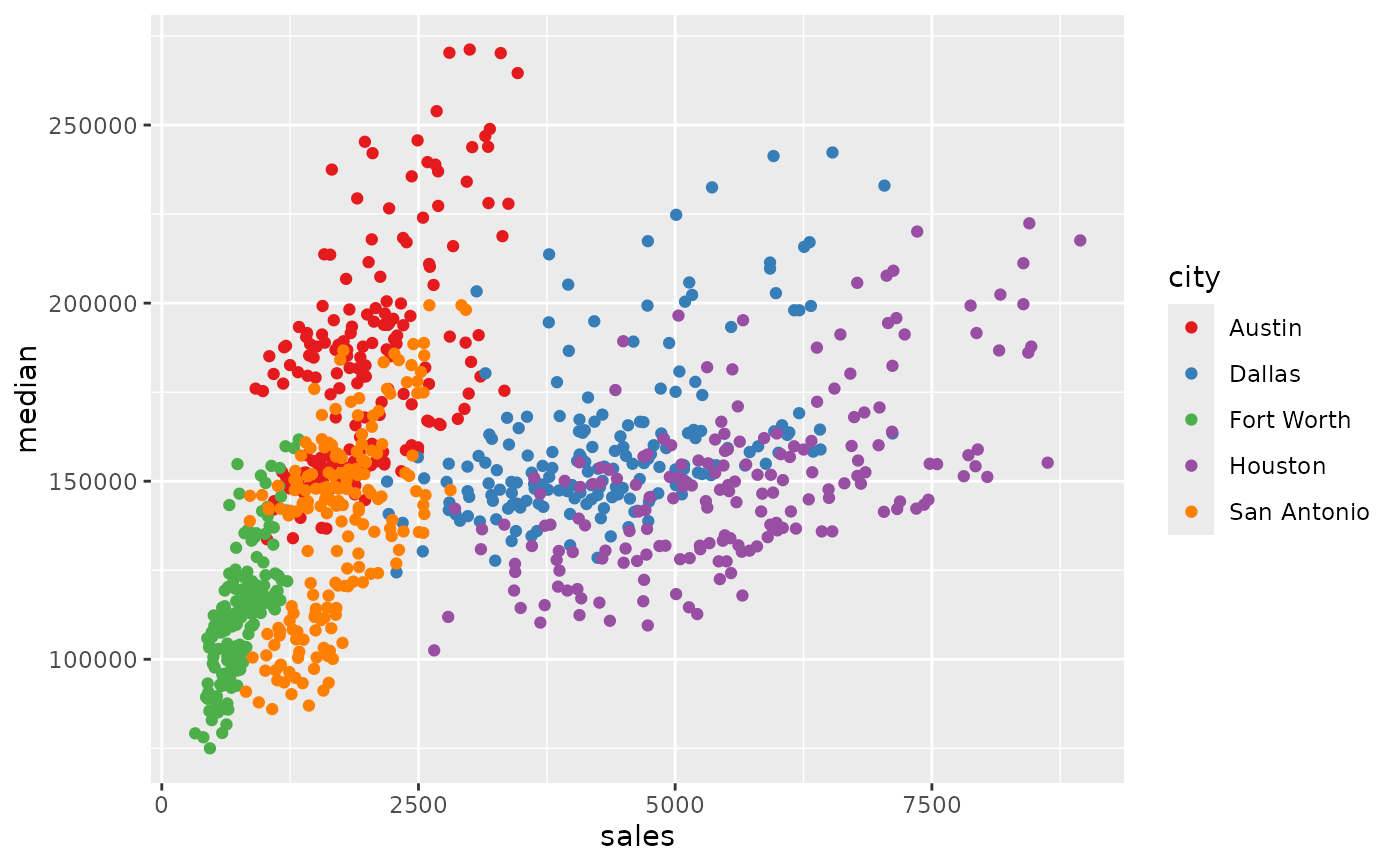
# Plot with a qualitative theme
d + scale_color_theme("Set 1")
 # Use a sequential theme as a discrete scale
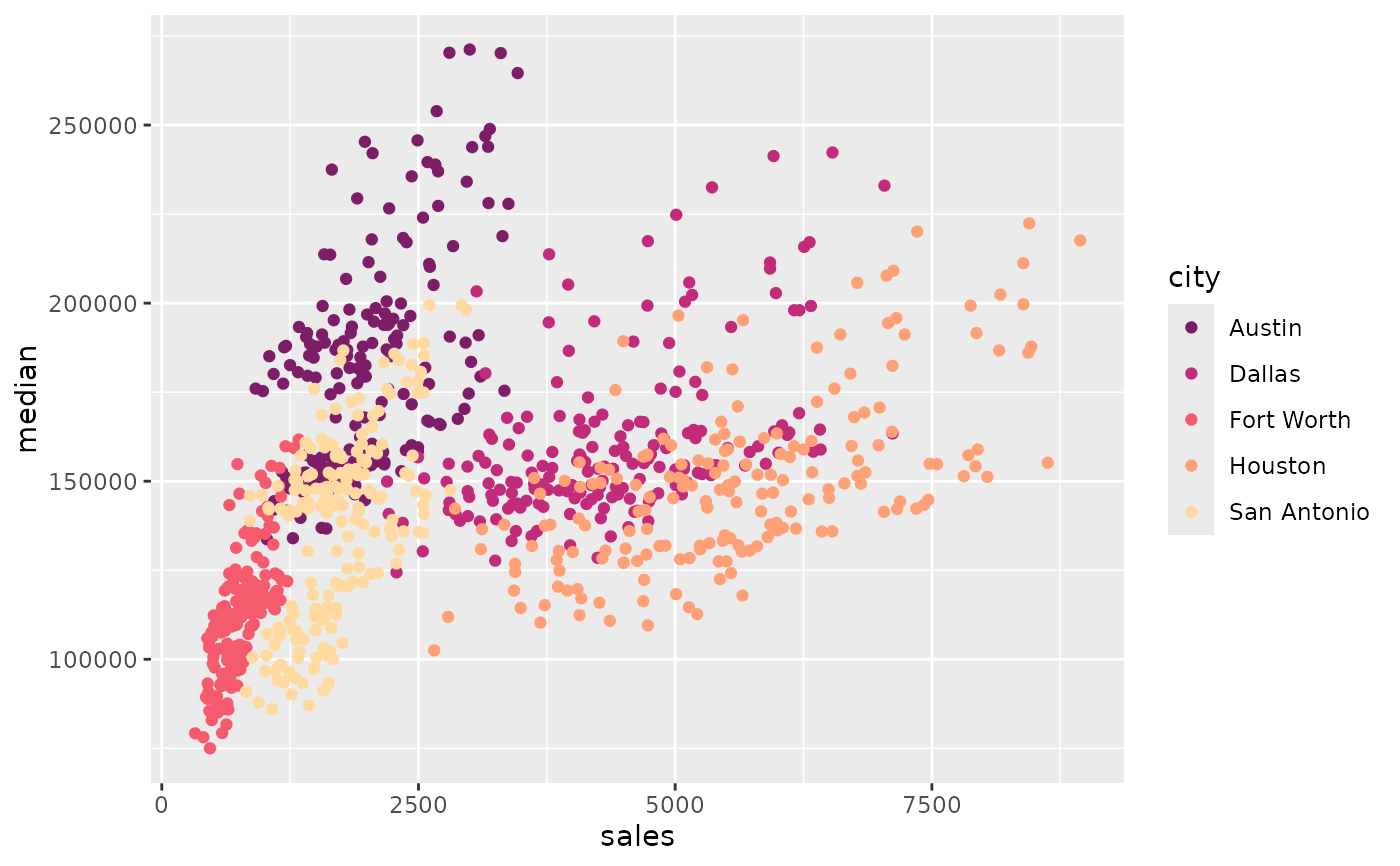
d + scale_color_theme("SunsetDark", discrete = TRUE)
# Use a sequential theme as a discrete scale
d + scale_color_theme("SunsetDark", discrete = TRUE)
 data(faithfuld, package = "ggplot2")
v <- ggplot2::ggplot(faithfuld) +
ggplot2::geom_tile(ggplot2::aes(waiting, eruptions, fill = density))
# Plot with continuous themes
v + scale_fill_theme("Plasma")
data(faithfuld, package = "ggplot2")
v <- ggplot2::ggplot(faithfuld) +
ggplot2::geom_tile(ggplot2::aes(waiting, eruptions, fill = density))
# Plot with continuous themes
v + scale_fill_theme("Plasma")
 # Use a diverging theme with a specified midpoint
v + scale_fill_theme("midr", middle = 0.017)
# Use a diverging theme with a specified midpoint
v + scale_fill_theme("midr", middle = 0.017)