# load required packages
library(midr)
library(ISLR2)

# train a predictive MID model
mid <- interpret(
  bikers ~ (mnth + hr + as.factor(workingday) +
    weathersit + temp + hum + windspeed)^2, # model formula
  data = Bikeshare, # training data
  lambda = .01 # smoothing parameter
)
#> 'model' not passed: response variable in 'data' is used
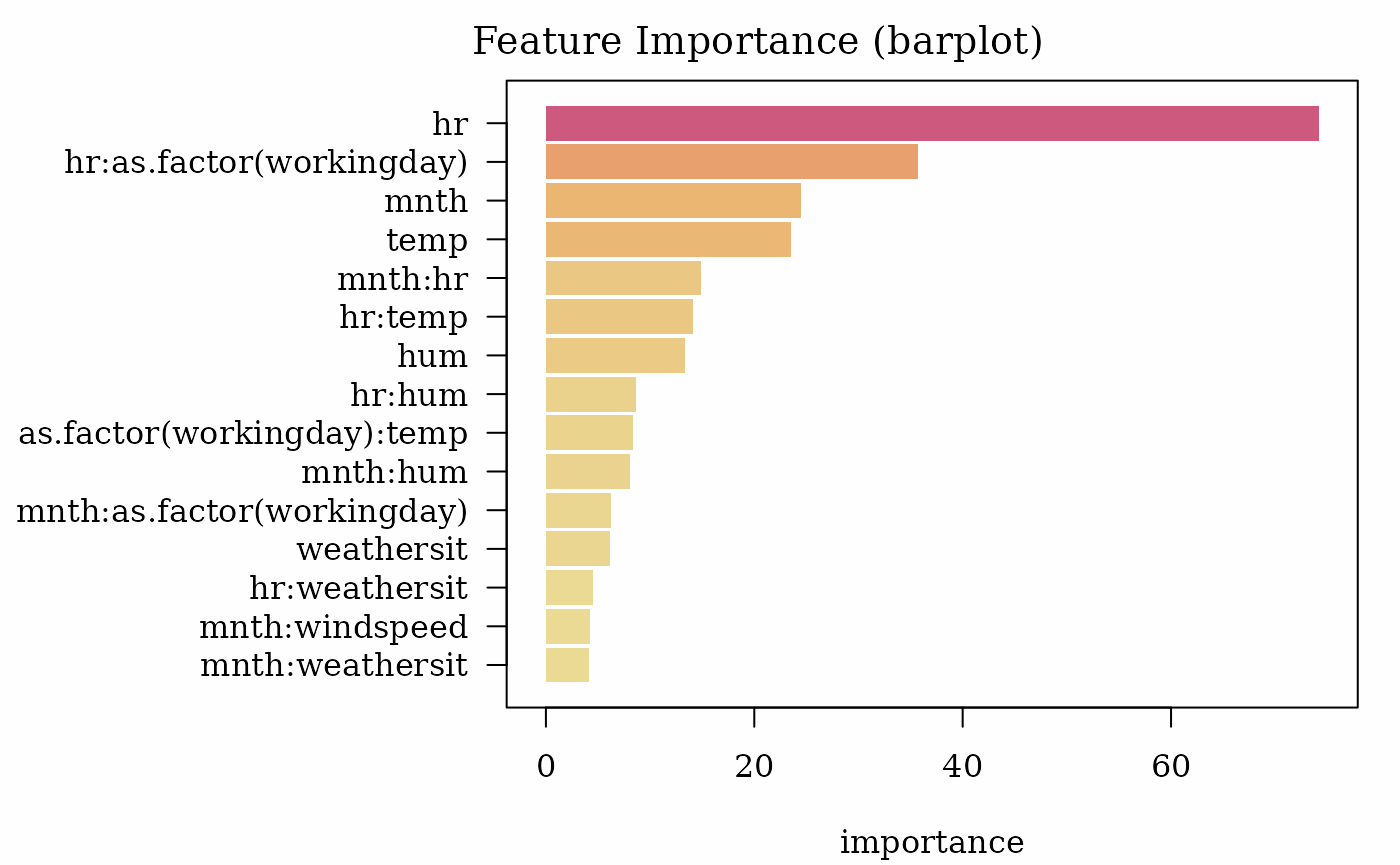
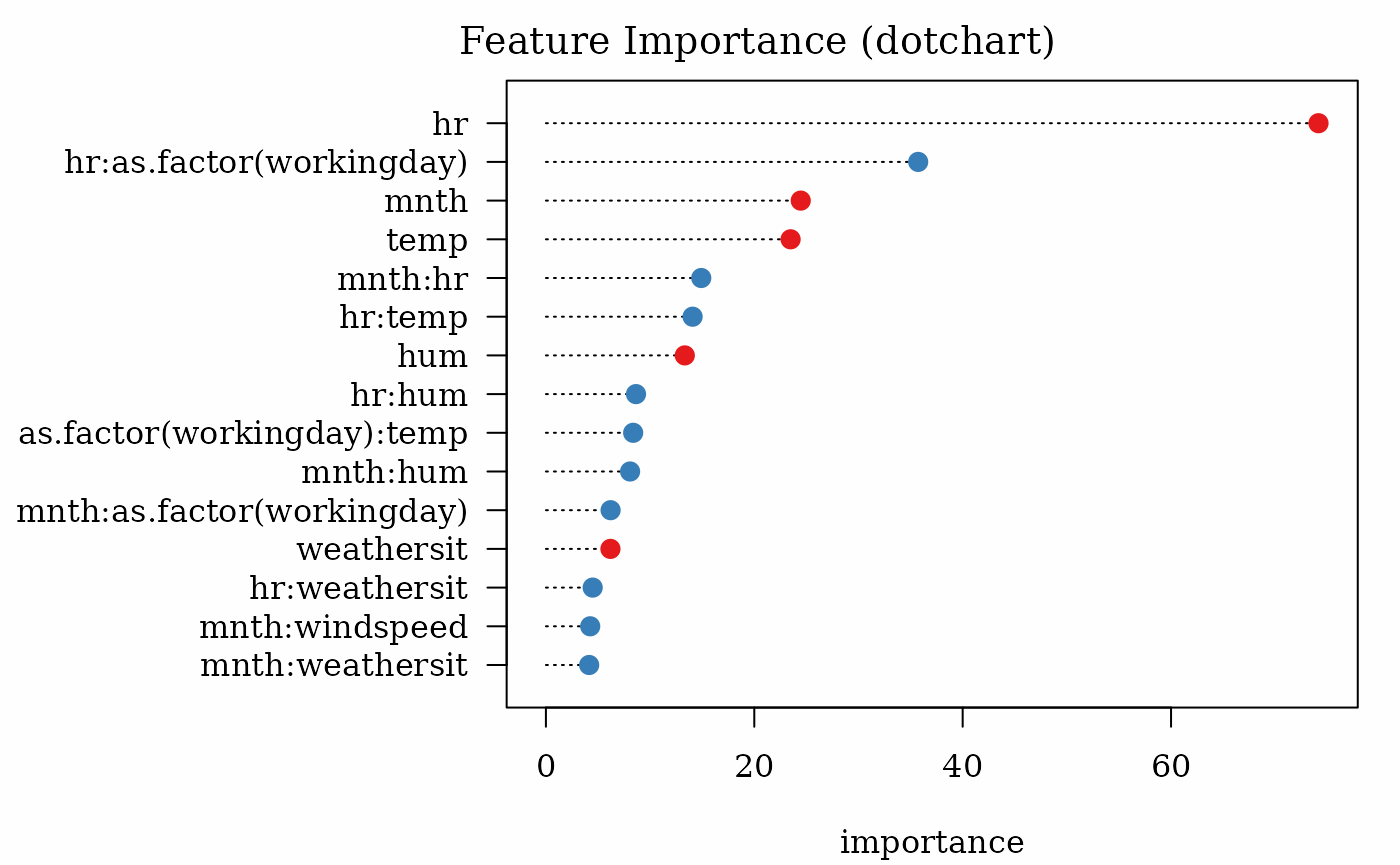
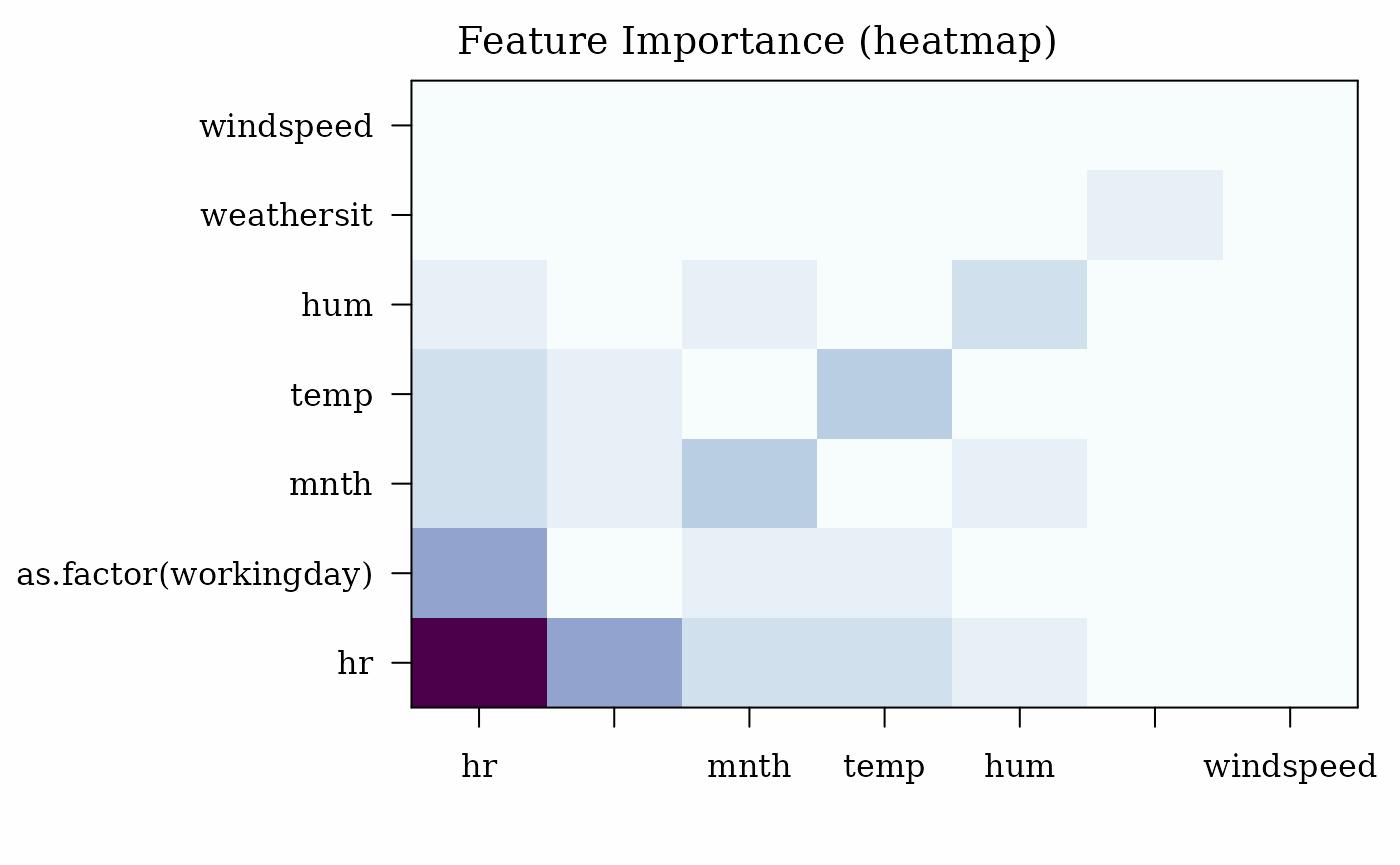
Feature Importance
# compute MID based variable importance
imp <- mid.importance(mid)

# create importance plots
par.midr(bg = "#FEFEFE")
plot(imp, theme = "Temps", max = 15)
title(main = 'Feature Importance (barplot)')
plot(imp, type = "dotchart", theme = "Set 1", max = 15, cex = 1.4)
title(main = 'Feature Importance (dotchart)')
plot(imp, type = "heatmap", theme = "BuPu")
title(main = 'Feature Importance (heatmap)')
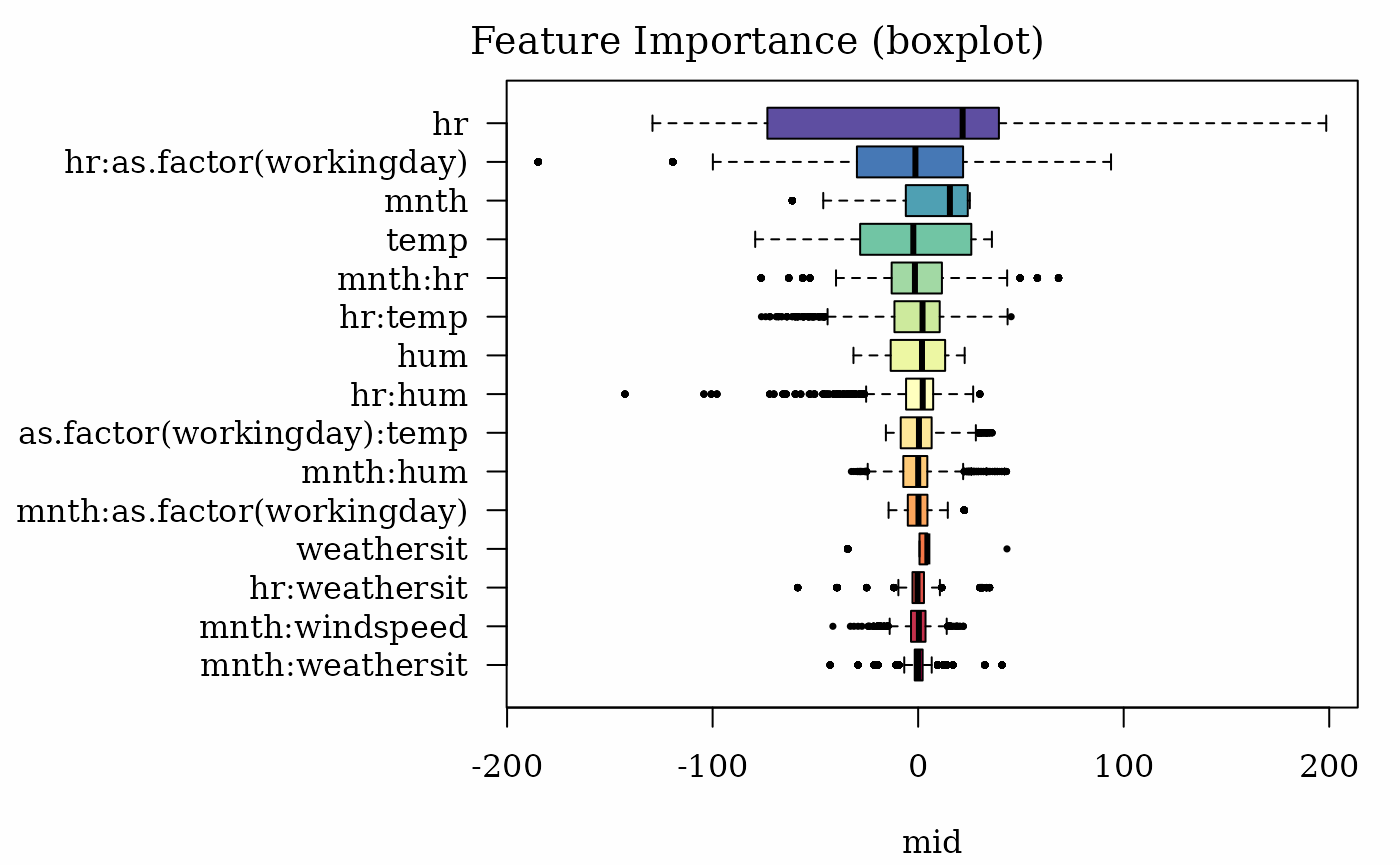
plot(imp, type = "boxplot", theme = "Spectral", max = 15, cex = .5)
title(main = 'Feature Importance (boxplot)')
Component Functions
# create component plots
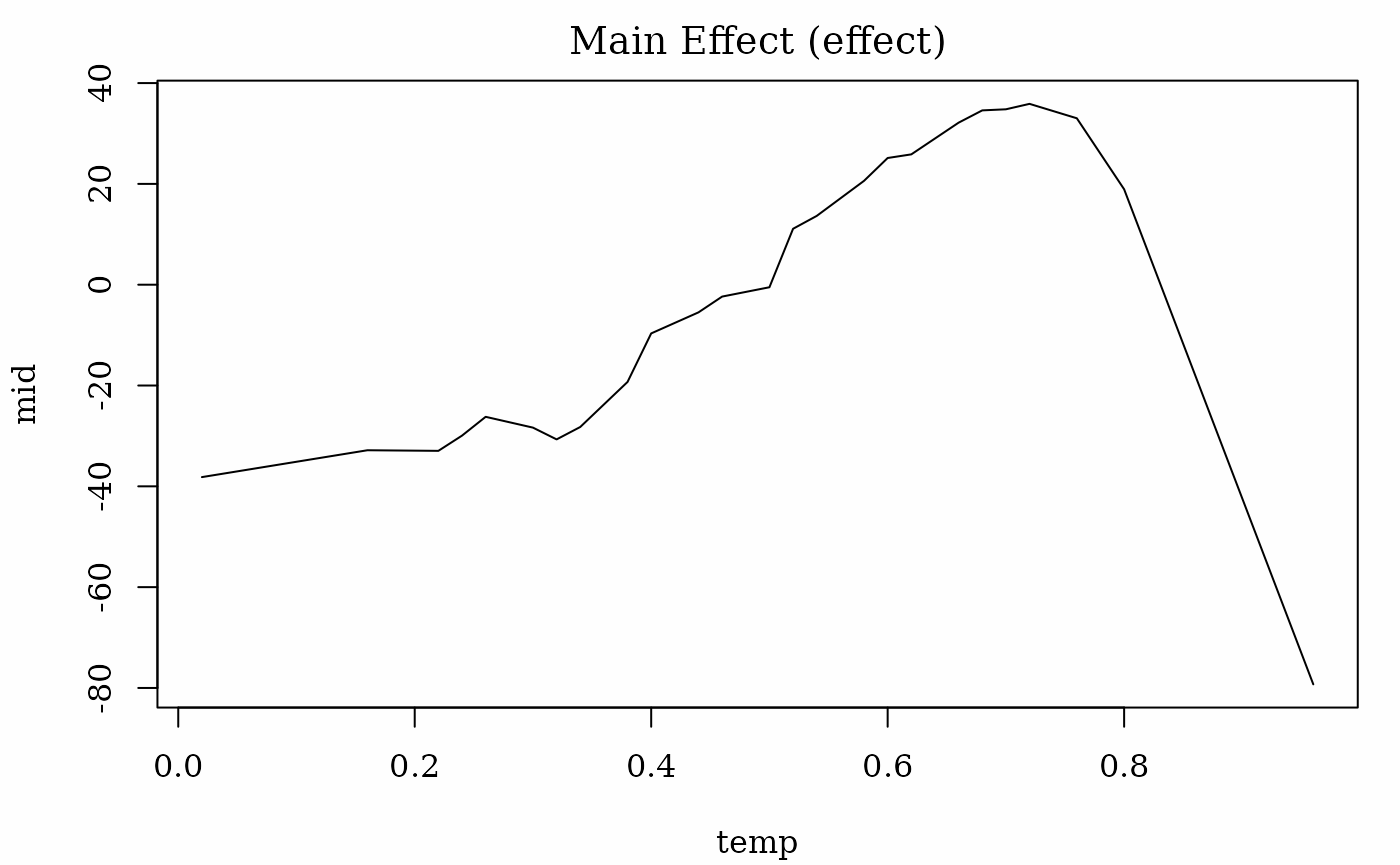
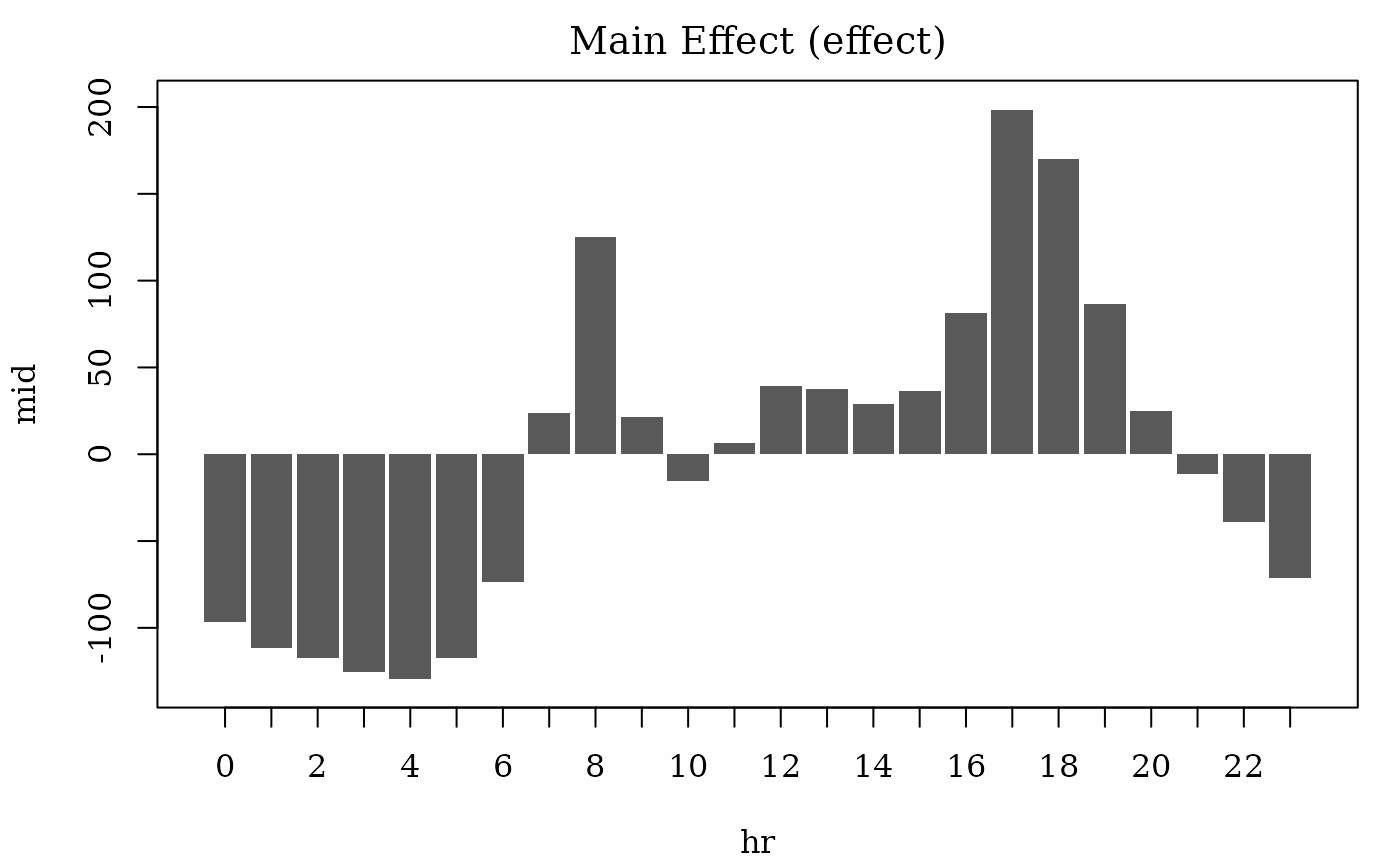
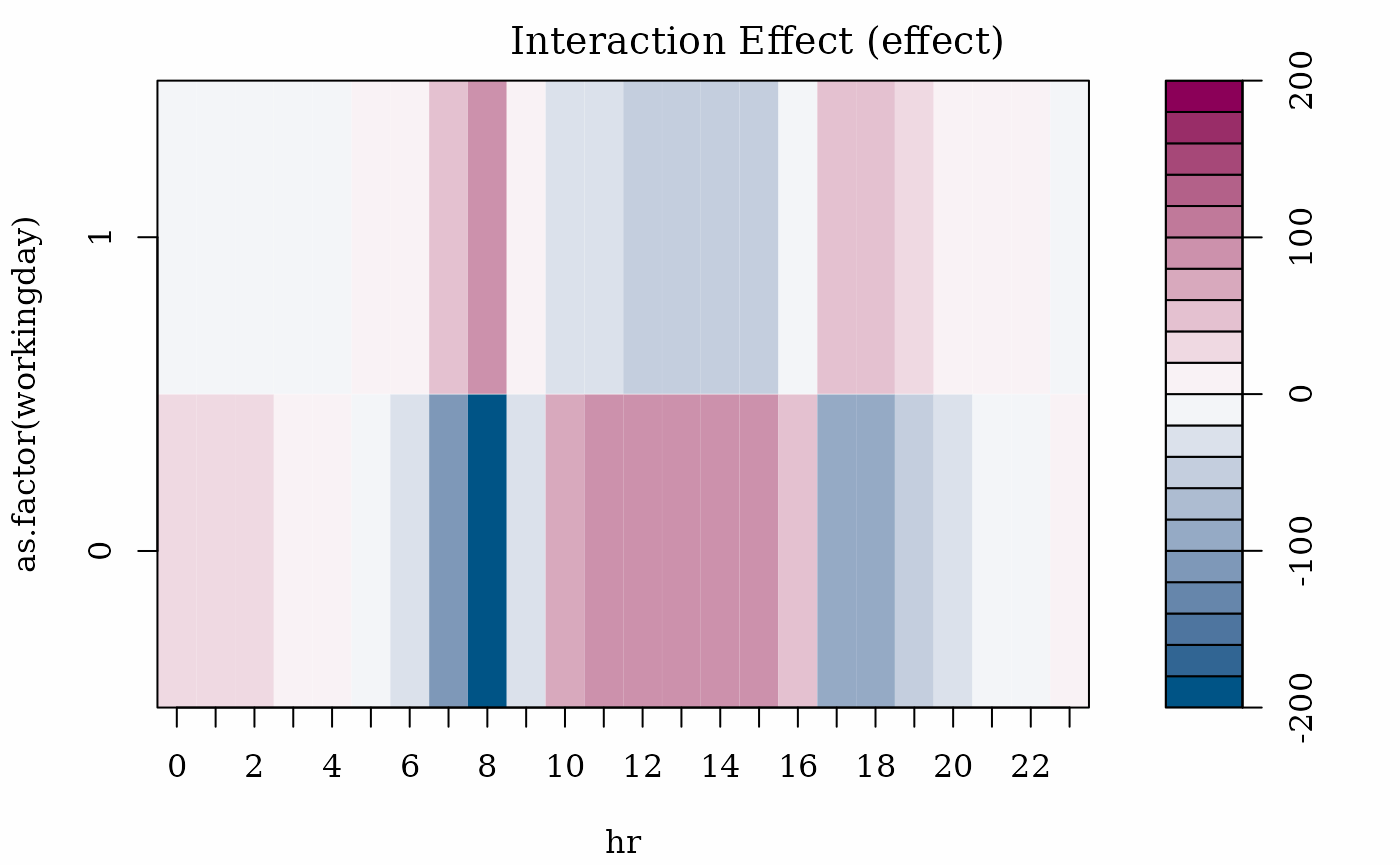
par.midr(bg = "#FEFEFE")
plot(mid, term = "temp")
title(main = 'Main Effect (effect)')
plot(mid, term = "hr")
title(main = 'Main Effect (effect)')
plot(mid, term = "hr:as.factor(workingday)")
title(main = 'Interaction Effect (effect)')
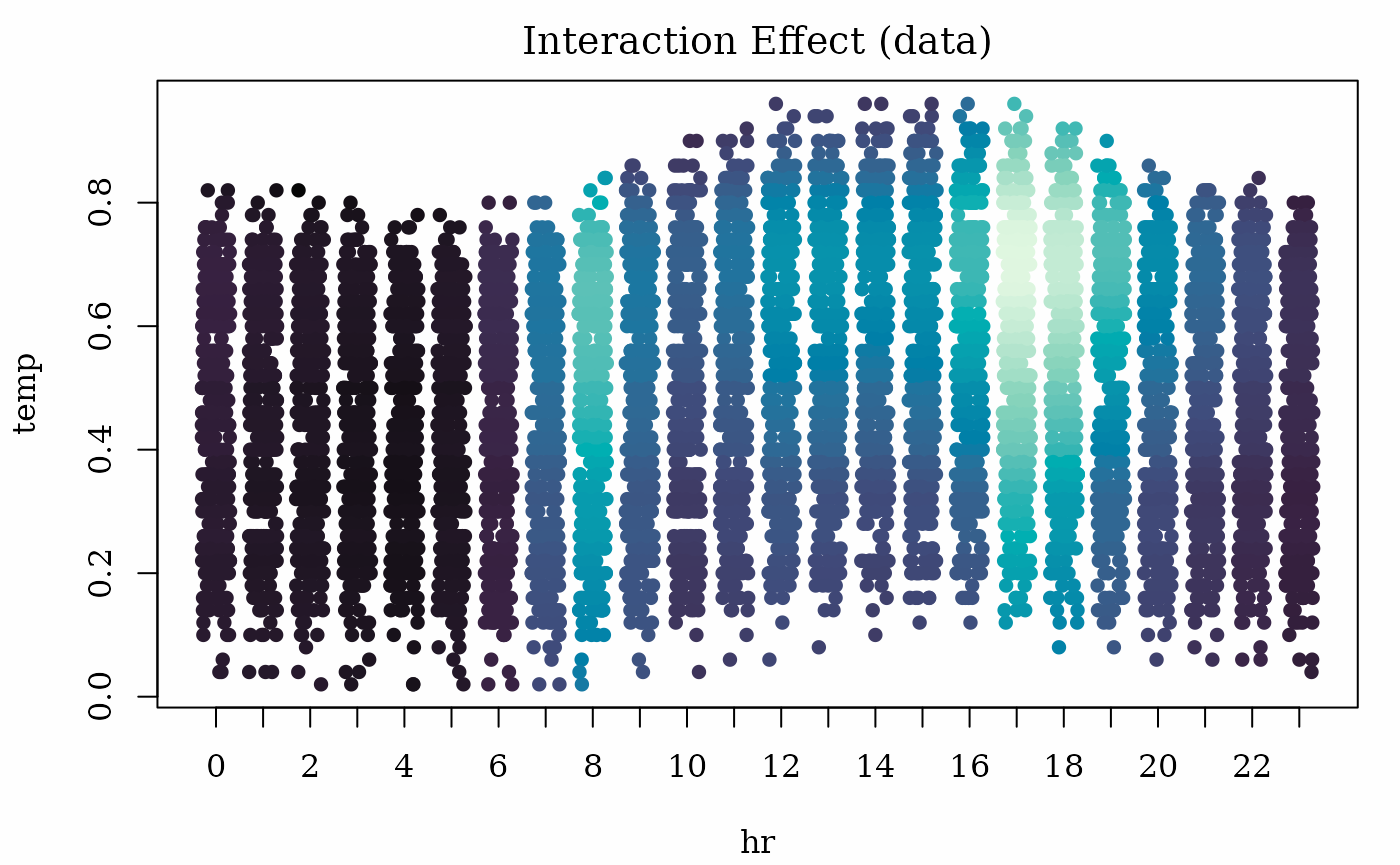
plot(mid, term = "hr:temp", type = "data",
     main.effects = TRUE, theme = "Mako", data = Bikeshare)
title(main = 'Interaction Effect (data)')
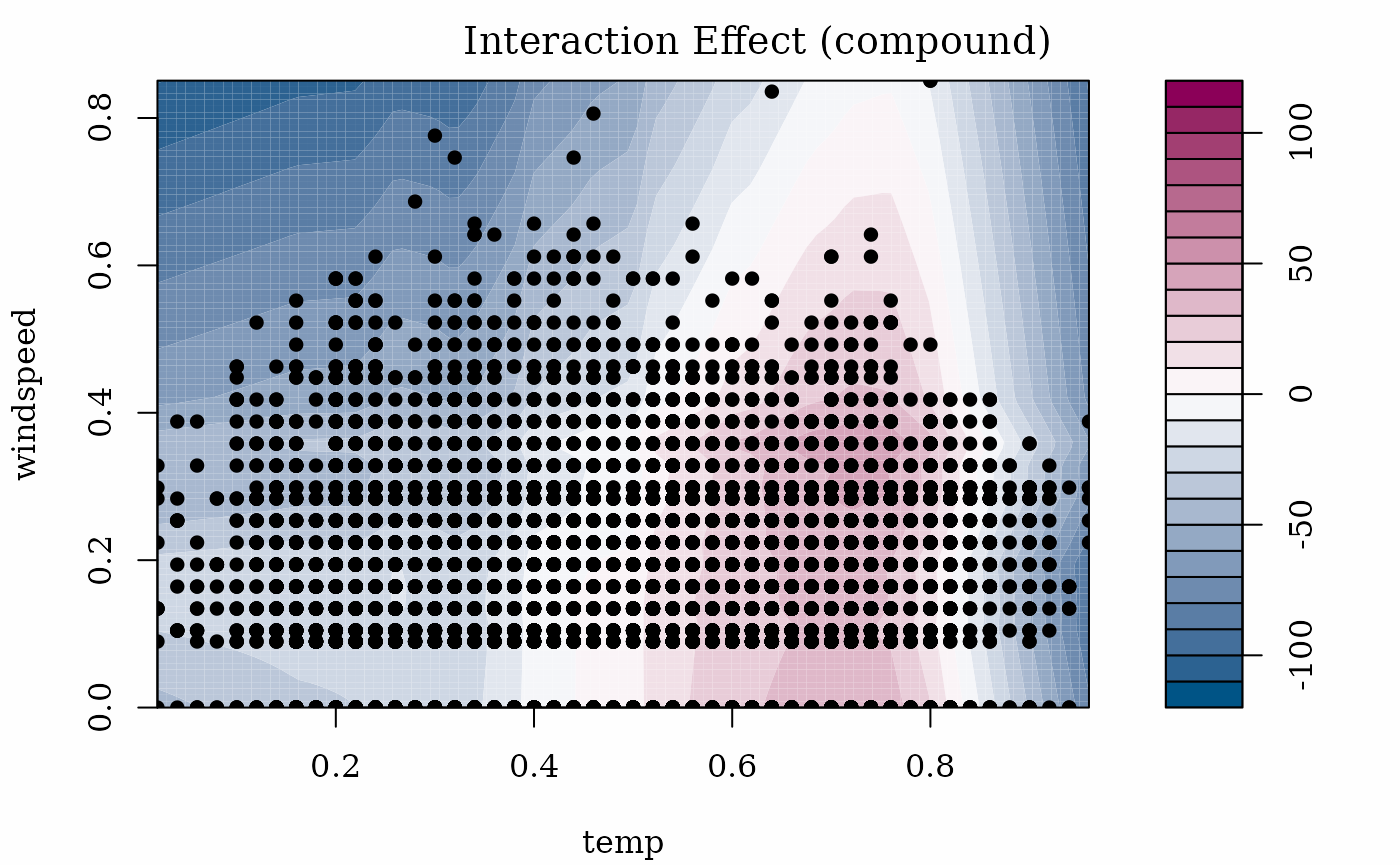
plot(mid, term = "temp:windspeed", type = "compound",
     main.effects = TRUE, data = Bikeshare)
title(main = 'Interaction Effect (compound)')
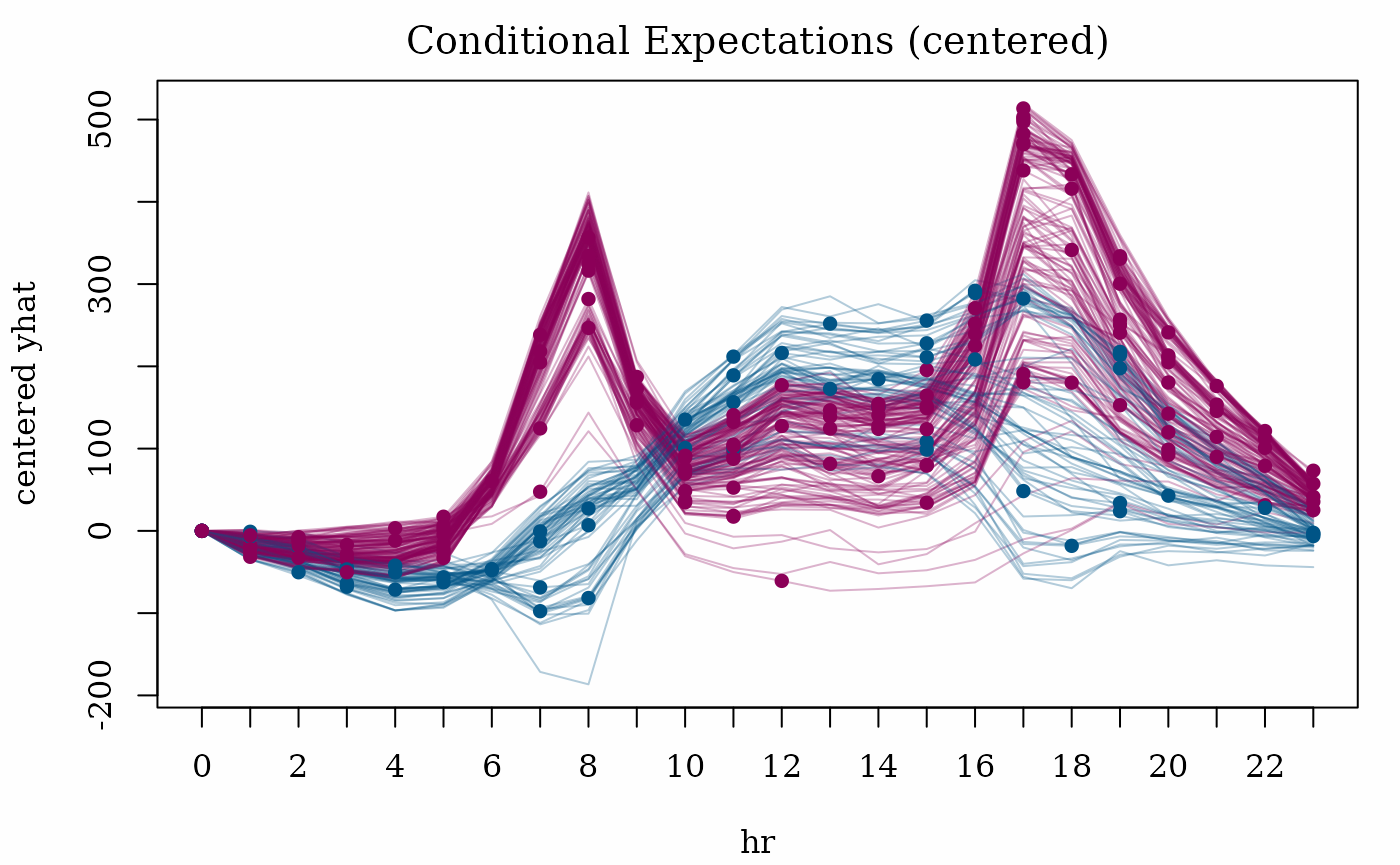
Conditional Expectations
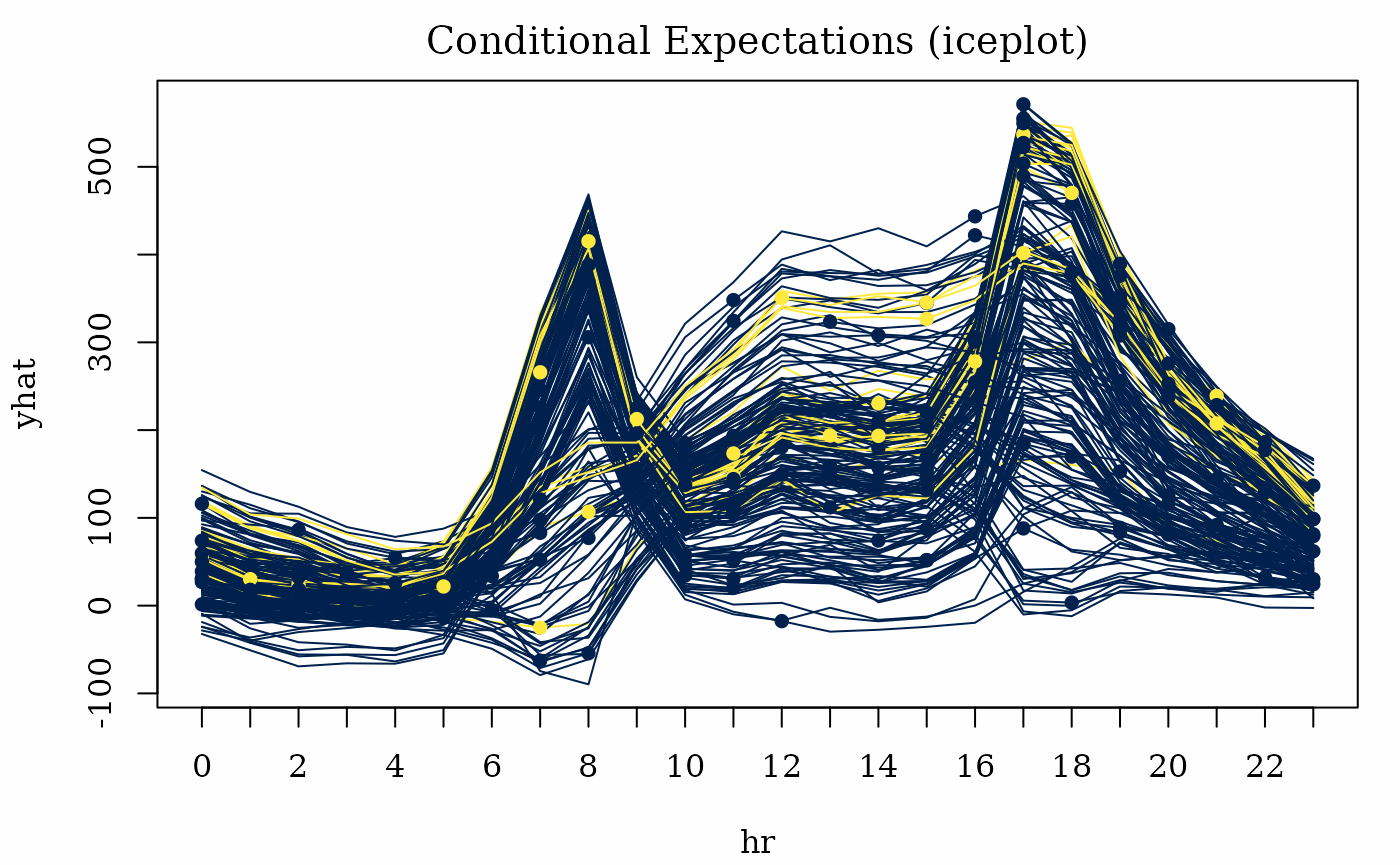
# compute ICE plots
set.seed(42)
ice_rows <- sample(nrow(Bikeshare), 200L)
ice <- mid.conditional(mid, variable = "hr",
                       data = Bikeshare[ice_rows, ])
# create plots
par.midr(bg = "#FEFEFE")
plot(ice, theme = "Cividis", var.color = mnth == "Aug")
title(main = 'Conditional Expectations (iceplot)')
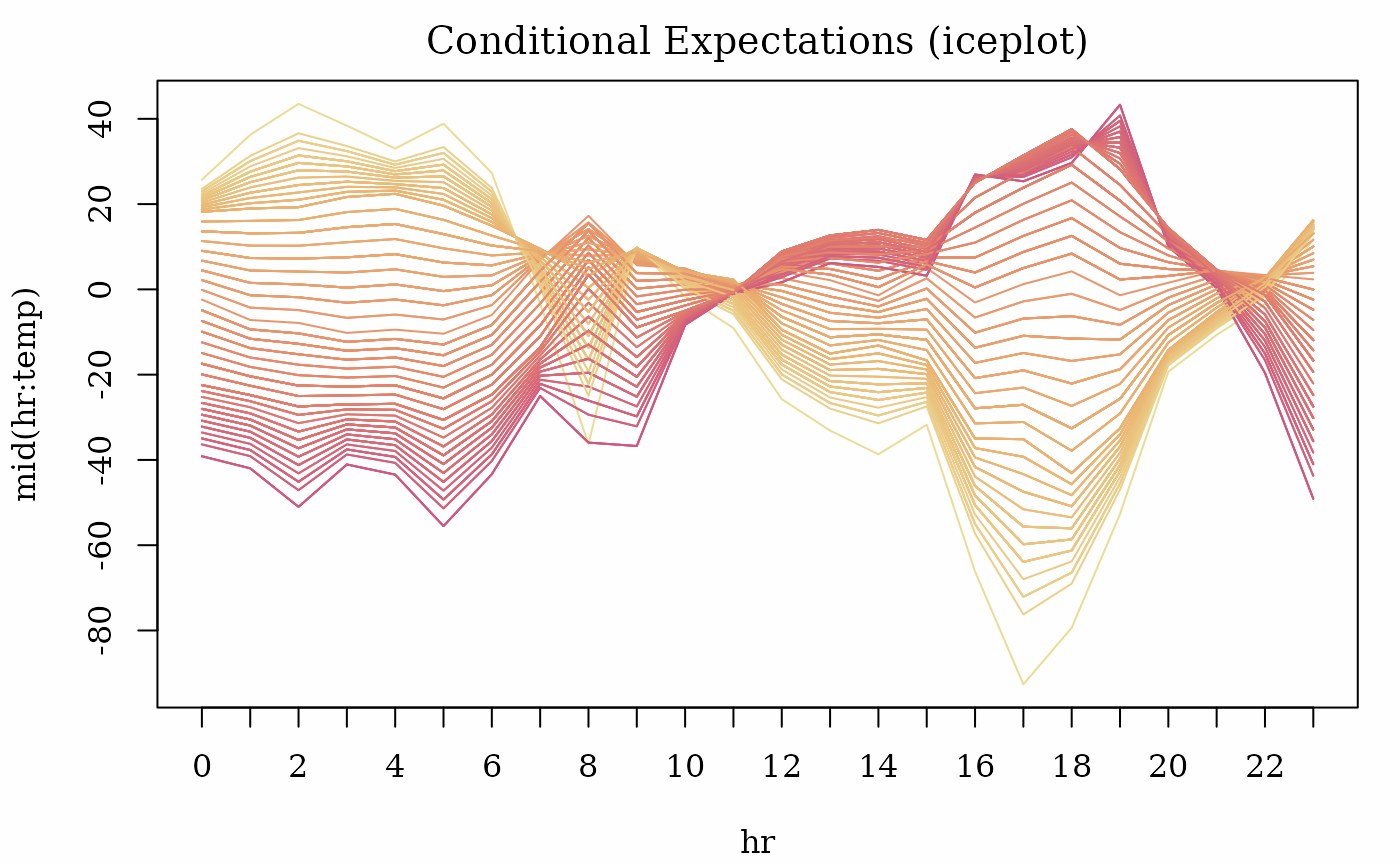
plot(ice, term = "hr:temp", dots = FALSE,
     theme = "Temps", var.color = temp)
title(main = 'Conditional Expectations (iceplot)')
plot(ice, type = "centered", alpha = .3,
     theme = "midr", var.color = `as.factor(workingday)`)
title(main = 'Conditional Expectations (centered)')
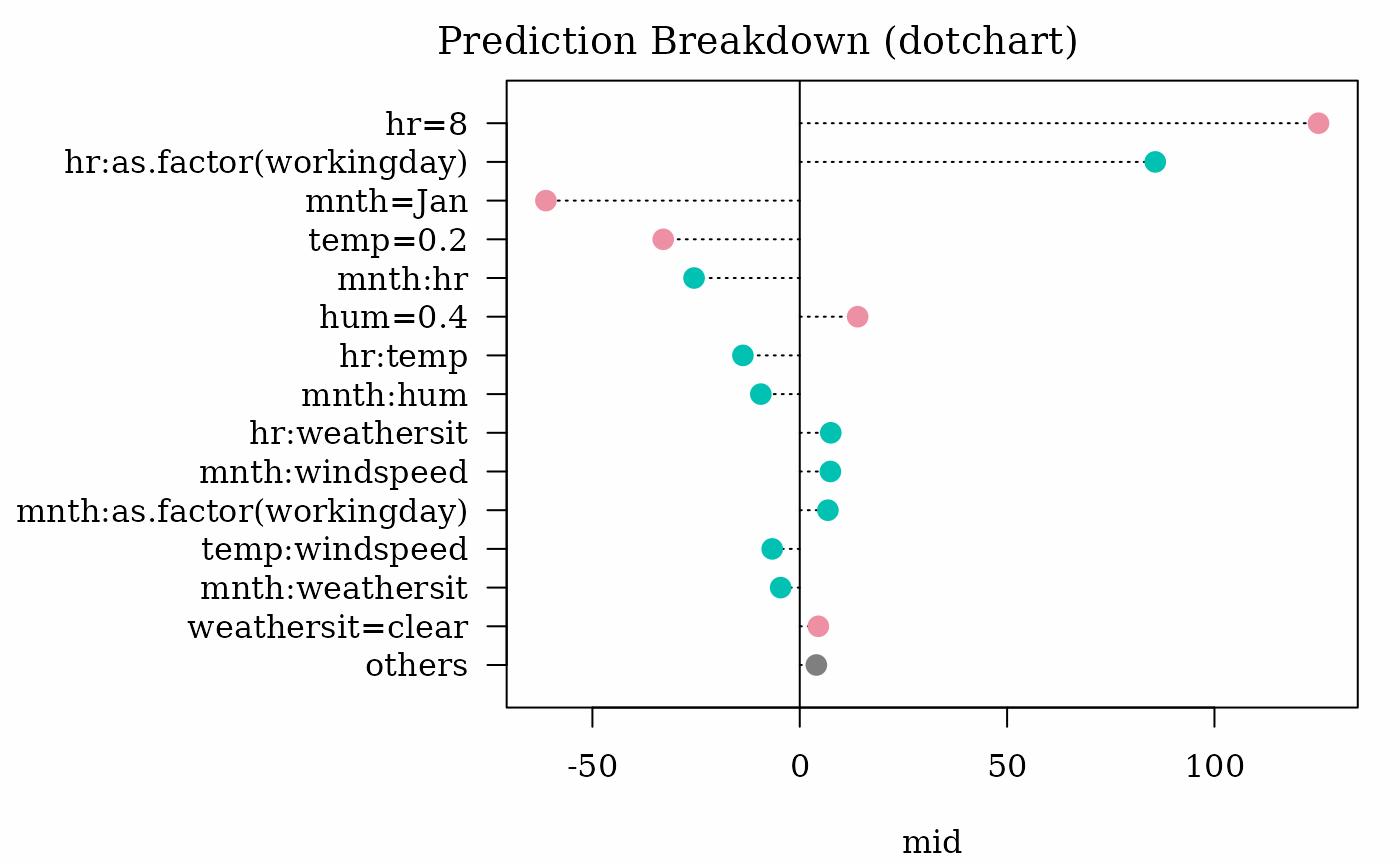
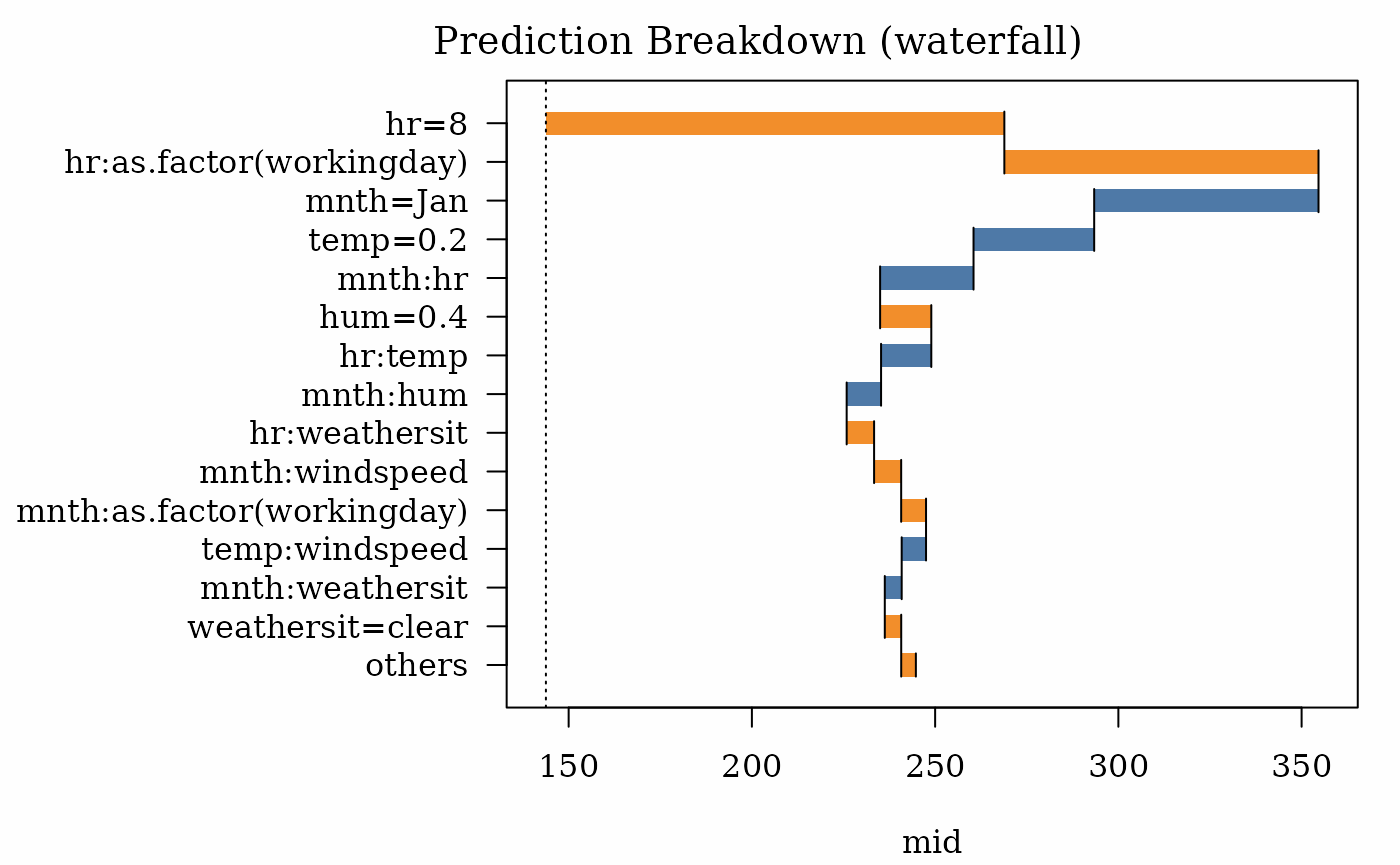
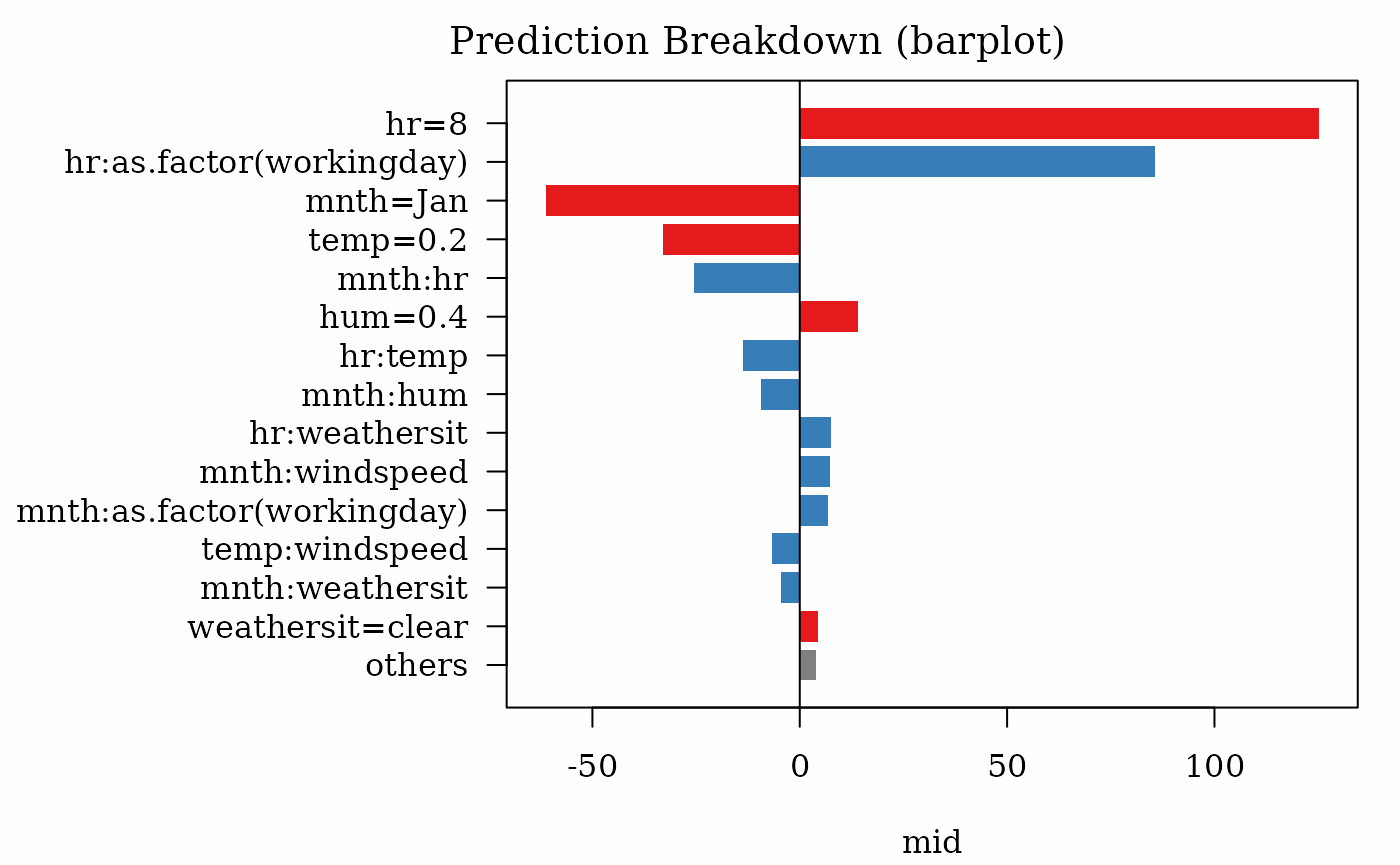
Prediction Breakdown
# compute MID breakdown for the individual penguins
bd100 <- mid.breakdown(mid, Bikeshare[100L, ])

# create plots
par.midr(bg = "#FEFEFE")
plot(bd100, theme = "Tableau 10")
title(main = 'Prediction Breakdown (waterfall)')
plot(bd100, type = "barplot", theme = "Set 1")
title(main = 'Prediction Breakdown (barplot)')
plot(bd100, type = "dotchart", theme = "Set 2", cex = 1.5)
title(main = 'Prediction Breakdown (dotchart)')