For "mid" objects (i.e., fitted MID models), plot() visualizes a single component function specified by the term argument.
Arguments
- x
a "mid" object to be visualized.
- term
a character string specifying the component function to be plotted.
- type
the plotting style. One of "effect", "data" or "compound".
- theme
a character string or object defining the color theme. See
color.themefor details.- intercept
logical. If
TRUE, the intercept is added to the MID values.- main.effects
logical. If
TRUE, main effects are included in the interaction plot.- data
a data frame to be plotted with the corresponding MID values. If not provided, data is automatically extracted from the function call.
- limits
a numeric vector of length two specifying the limits of the plotting scale.
- jitter
a numeric value specifying the amount of jitter for the data points.
- resolution
an integer or vector of two integers specifying the resolution of the raster plot for interactions.
- lumped
logical. If
TRUE, uses the lumped factor levels; ifFALSE, uses the original levels from the data. AlwaysFALSEwhenmain.effects = TRUE.- ...
optional parameters to be passed to the graphing function. Possible arguments are "col", "fill", "pch", "cex", "lty", "lwd" and aliases of them.
Details
This is an S3 method for the plot() generic that produces a plot from a "mid" object, visualizing a component function of the fitted MID model.
The type argument controls the visualization style.
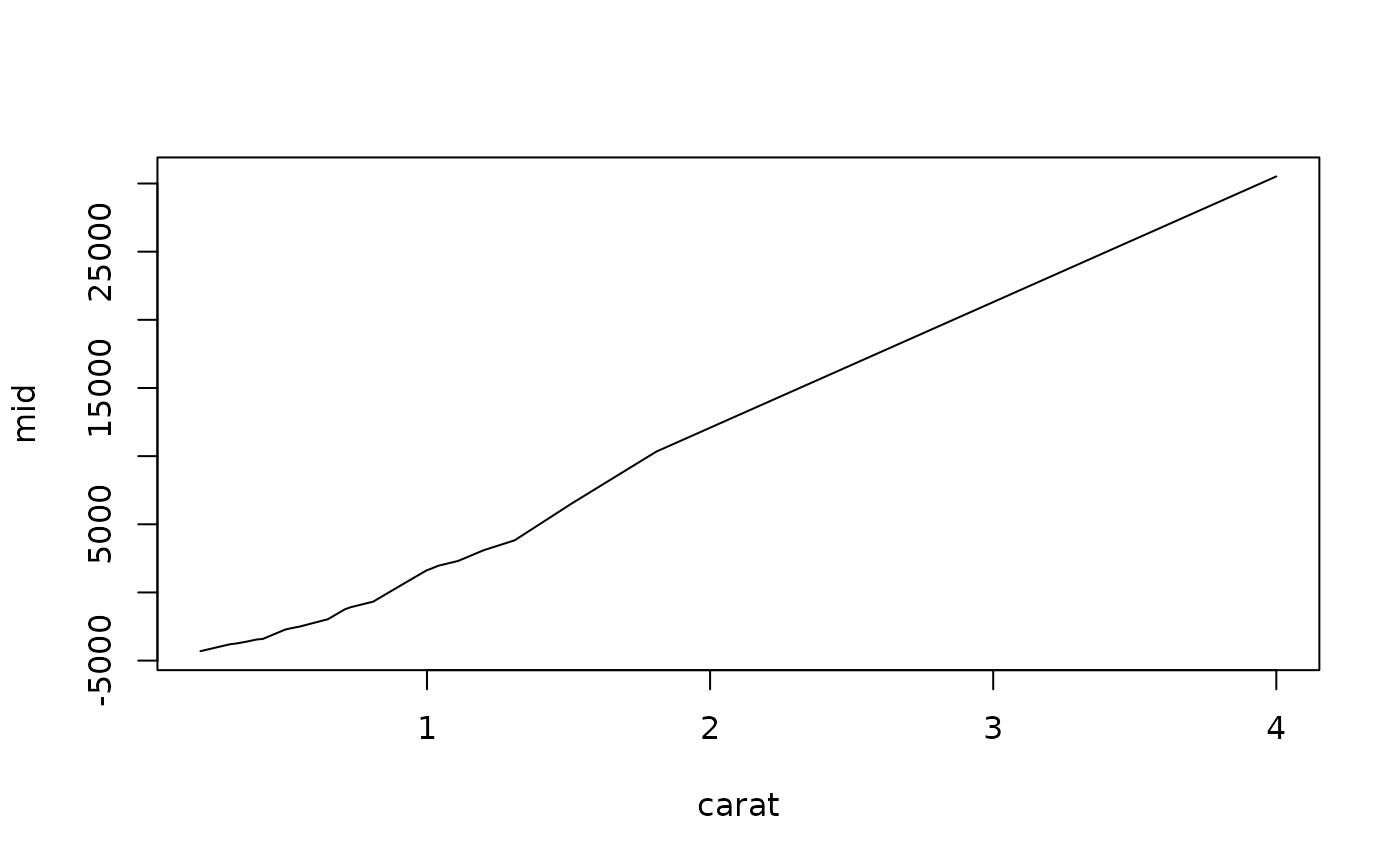
The default, type = "effect", plots the component function itself.
In this style, the plotting method is automatically selected based on the effect's type:
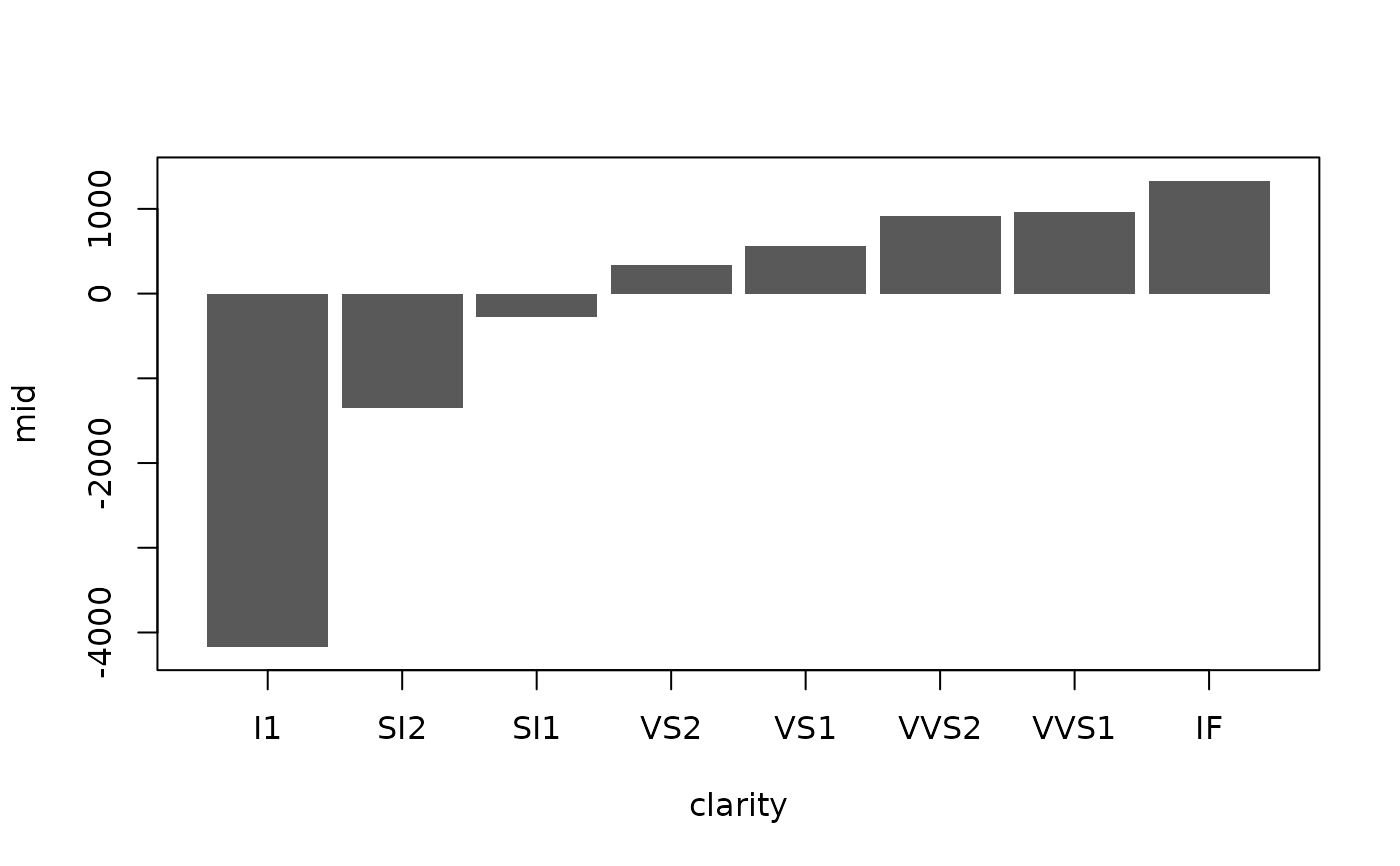
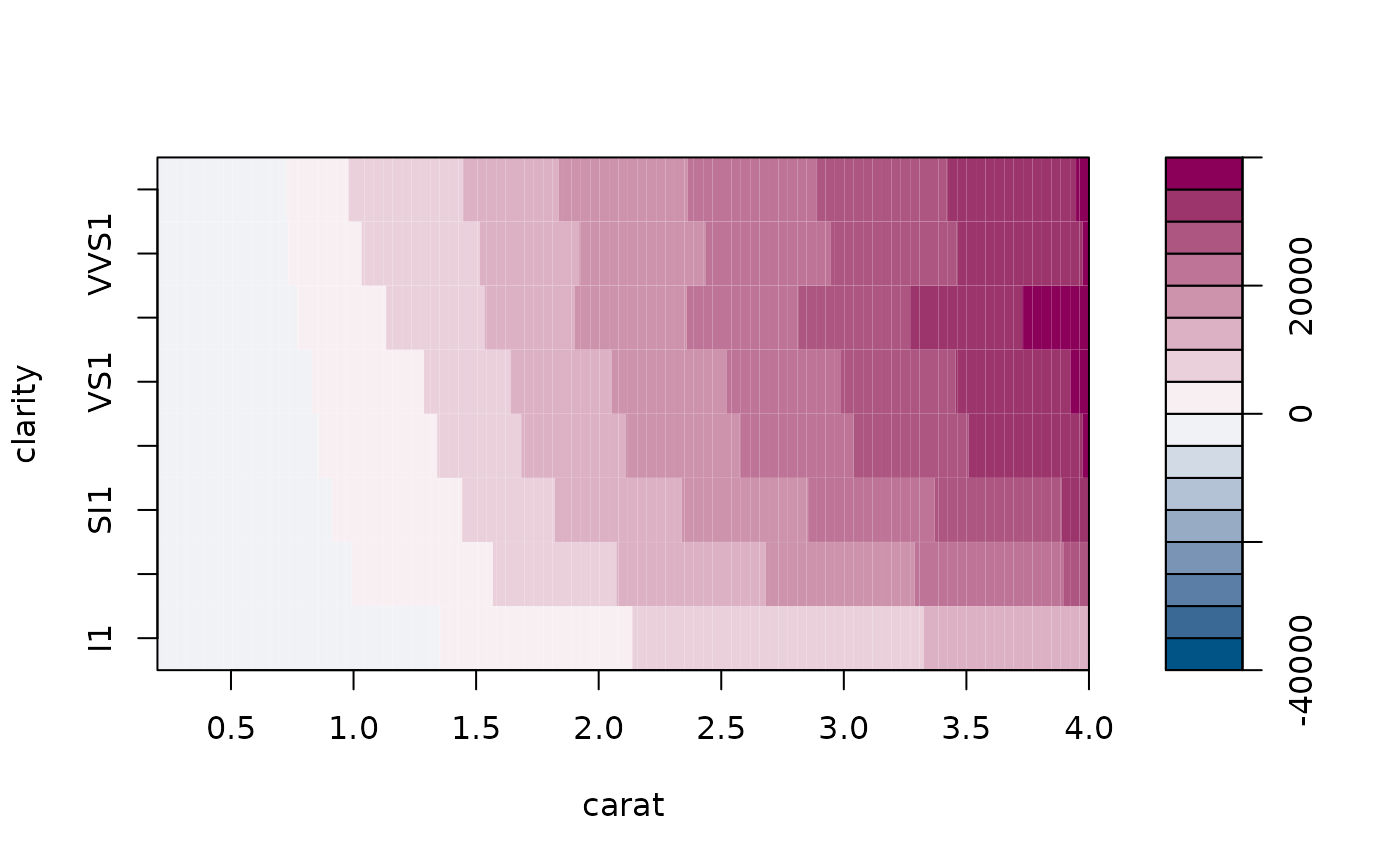
a line plot for quantitative main effects; a bar plot for qualitative main effects; and a filled contour (level) plot for interactions.
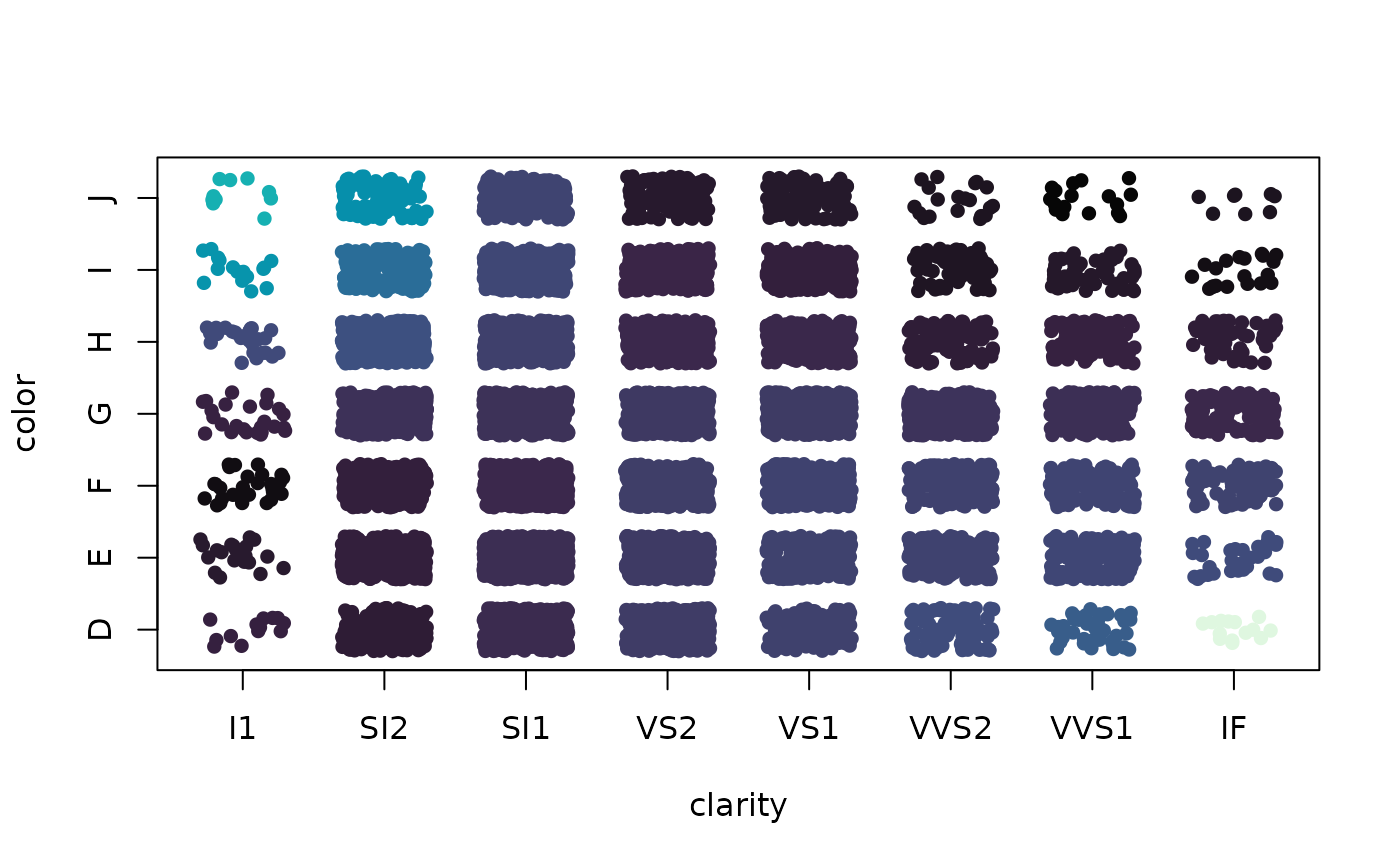
The type = "data" option creates a scatter plot of data, colored by the values of the component function.
The type = "compound" option combines both approaches, plotting the component function alongside the data points.
Examples
data(diamonds, package = "ggplot2")
set.seed(42)
idx <- sample(nrow(diamonds), 1e4)
mid <- interpret(price ~ (carat + cut + color + clarity)^2, diamonds[idx, ])
#> 'model' not passed: response variable in 'data' is used
# Plot a quantitative main effect
plot(mid, "carat")
 # Plot a qualitative main effect
plot(mid, "clarity")
# Plot a qualitative main effect
plot(mid, "clarity")
 # Plot an interaction effect with data points and a raster layer
plot(mid, "carat:clarity", type = "compound", data = diamonds[idx, ])
# Plot an interaction effect with data points and a raster layer
plot(mid, "carat:clarity", type = "compound", data = diamonds[idx, ])
 # Use a different color theme
plot(mid, "clarity:color", theme = "RdBu")
# Use a different color theme
plot(mid, "clarity:color", theme = "RdBu")