mid.plots() is a convenience function for applying ggmid() or plot() to multiple component functions of a "mid" object at once.
It can automatically determine common plotting scales and manage the layout.
Arguments
- object
a "mid" object.
- terms
a character vector of the terms to be visualized. By default, only the main effect terms are used.
- limits
a numeric vector of length two specifying the mid value limits.
NAvalues are replaced by the minimum and/or maximum of the plotted MID values. Ifintercept = TRUEis set, the intercept is also included in the limit calculation.- intercept
logical. If
TRUE, the intercept is added to the MID values and the plotting scale is shifted accordingly.- main.effects
logical. If
TRUE, main effects are added to the interaction plots to show conditional effects. This argument disables automatic limit calculations.- max.nplots
the maximum number of plots to generate.
- engine
the plotting engine to use, either "ggplot2" or "graphics".
- ...
optional parameters passed on to
plot.mid()orggmid().
Value
If engine is "ggplot2", mid.plots() returns a list of "ggplot" objects.
Otherwise (i.e., if engine is "graphics"), mid.plots() produces plots as side-effects and returns NULL invisibly.
Examples
data(diamonds, package = "ggplot2")
set.seed(42)
idx <- sample(nrow(diamonds), 1e4L)
mid <- interpret(price ~ (carat + cut + color + clarity) ^ 2, diamonds[idx, ])
#> 'model' not passed: response variable in 'data' is used
# Plot selected main effects and interaction using the ggplot2 engine
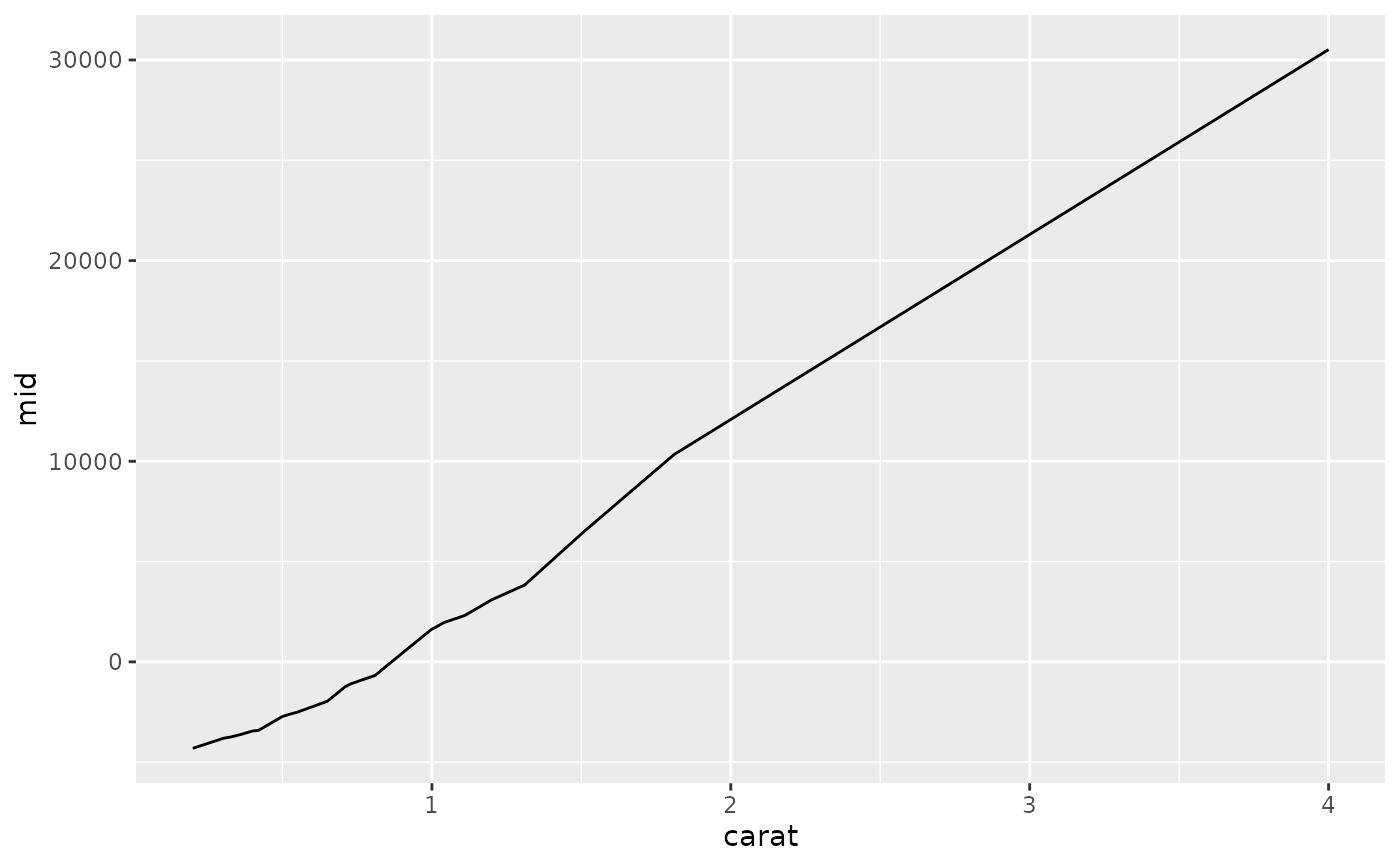
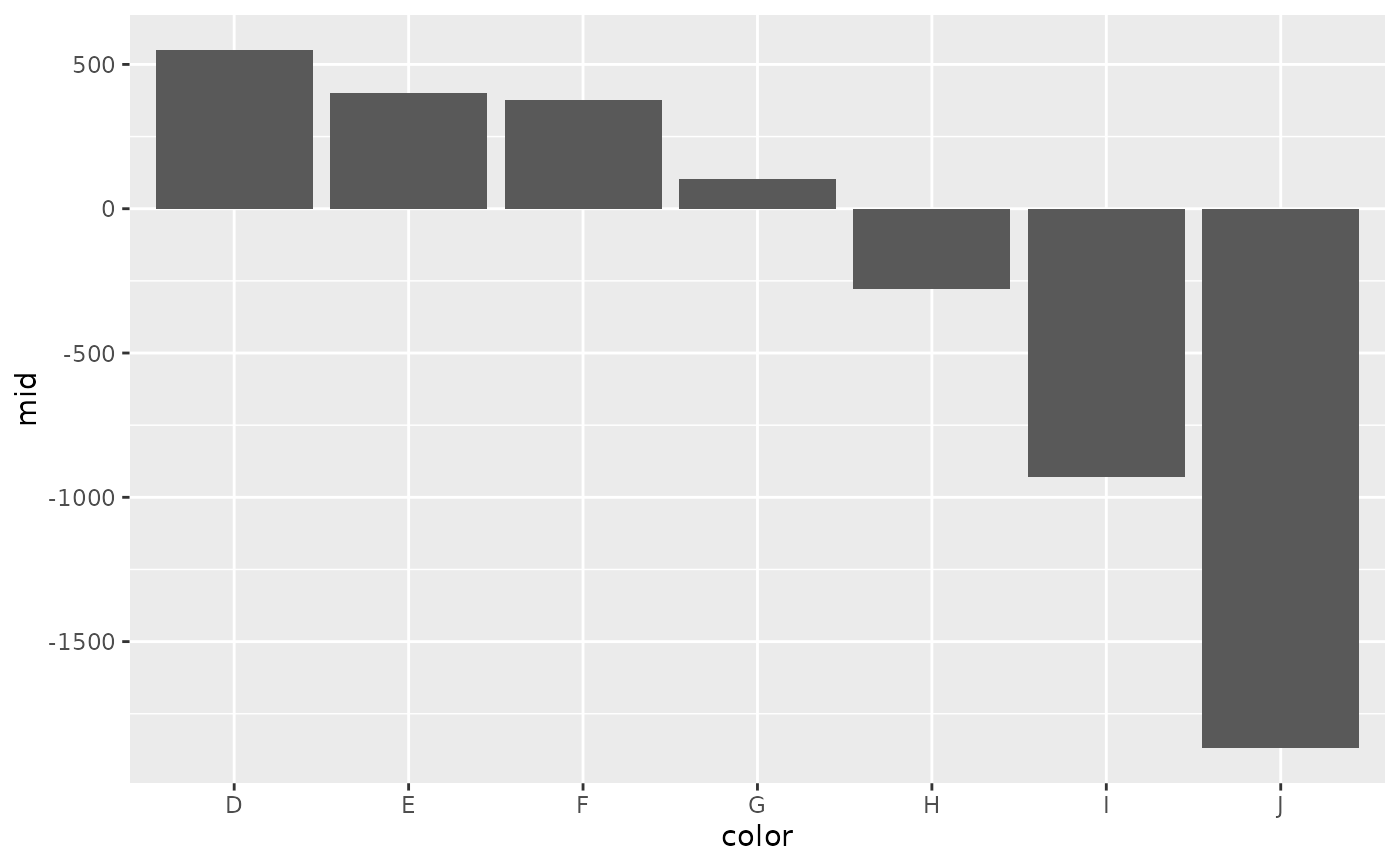
mid.plots(mid, mid.terms(mid, require = "color", remove = "cut"), limits = NULL)
#> $color
 #>
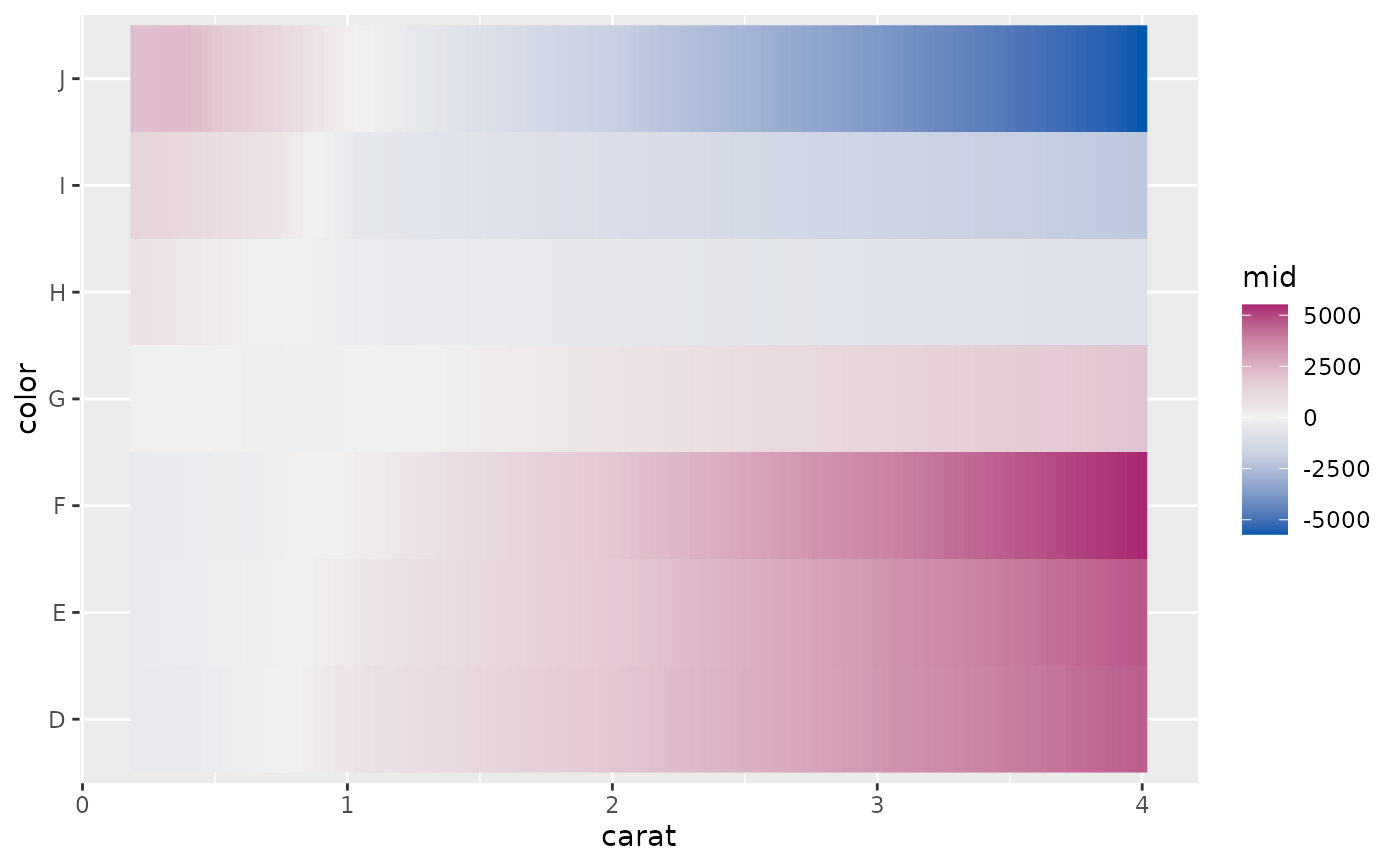
#> $`carat:color`
#>
#> $`carat:color`
 #>
#> $`color:clarity`
#>
#> $`color:clarity`
 #>
#>