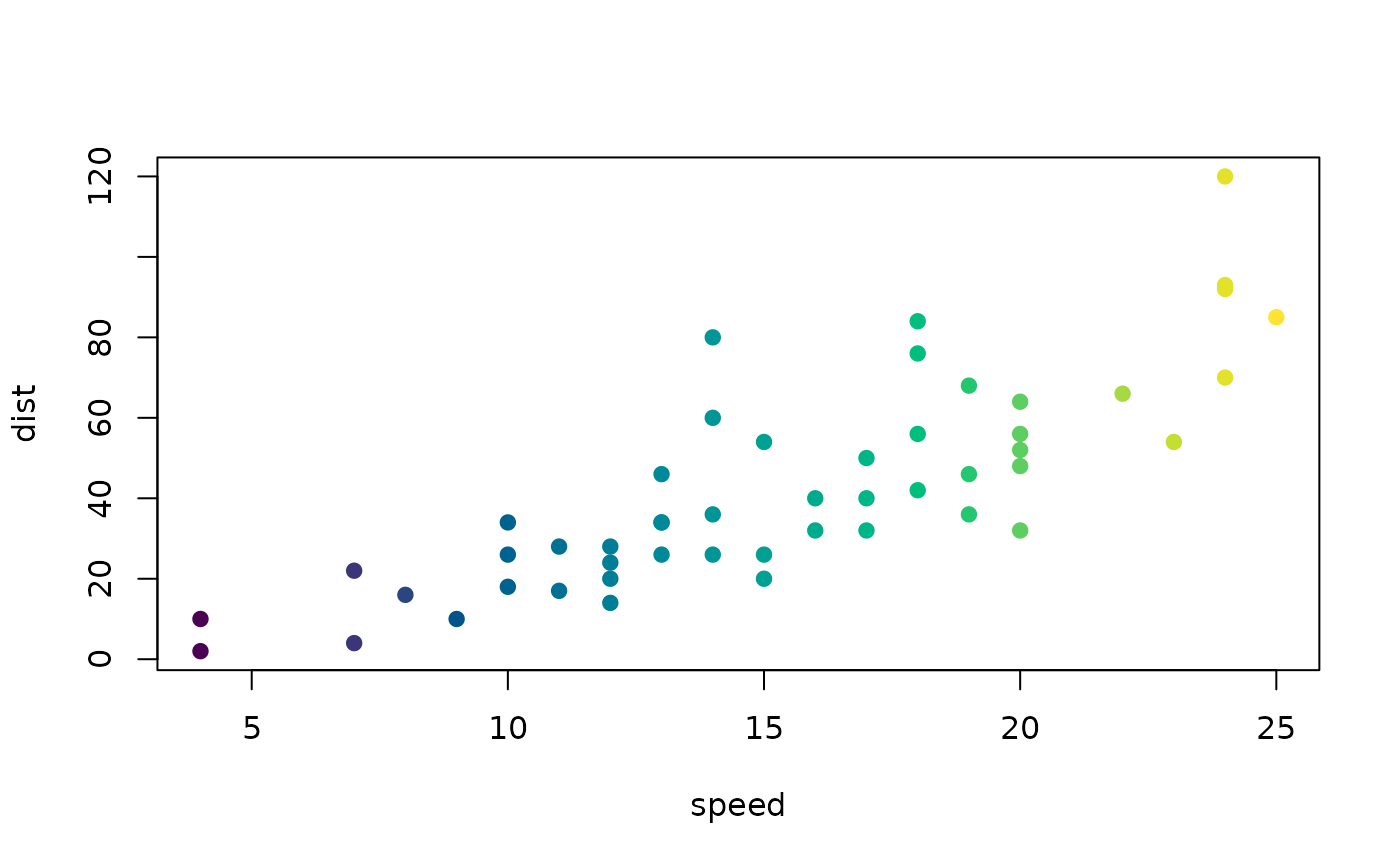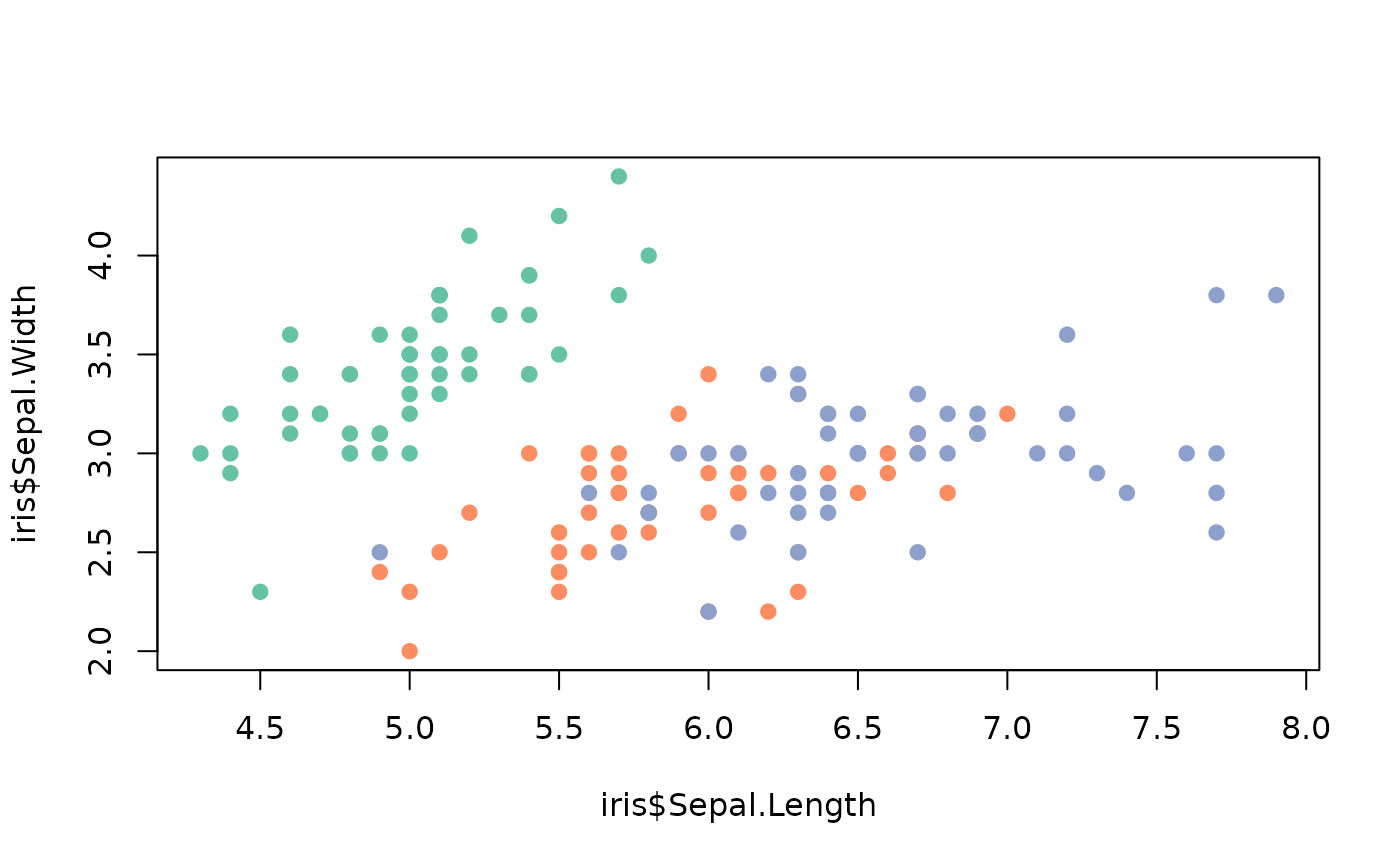
to.colors() maps a vector of data values to a vector of hexadecimal color codes based on a specified color theme.
It automatically handles both discrete and continuous variables, appropriately scaling the values and handling missing data.
Arguments
- x
a vector of data values (discrete or continuous) to be mapped to colors.
- theme
a color theme name (e.g., "Viridis"), a character vector of color names, or a palette/ramp function. See
?color.themefor more details.- middle
a numeric value specifying the middle point for the diverging color themes. Default is
0.- na.value
a character string specifying the color for
NAvalues. IfNULL(default), it falls back to the theme's defaultna.coloroption.