suppressMessages(require(tidyverse))
require(forcats)forcats
パッケージの概要
forcatsは、factor型のデータを取り扱うための様々な関数を提供しているパッケージです。
factor型について
factor型のベクトルは、ベクトルの要素に加えて、levelsという情報を持っています。例えば、a,b,cの要素を持つcharacter型のベクトルに対して、factor関数を適用するとfactor型のベクトルが得られます。
なお、ベクトル内の要素が重複している場合、Levelsではまとめて表示されます。以下の例では、「c」が重複していますが、Levelsで表示されるcは1つだけになっています。
x <- c("a", "c", "b", "c")
factor(x)
[1] a c b c
Levels: a b cfactor型の活用方法
factor型のlevelsは、例えば、データを可視化する際に活用できます。
具体例を確認するために、まず、Rのiris(あやめのがく片、花弁の幅・長さに関するデータセット)を用いて、あやめの種類(Species)別のがく片の幅の平均値をmean_Sepal_Widthに格納し、その結果を棒グラフで表示します。この際、iris_mean_by_speciesのSpeciesカラムはfactor型になっていることに注意してください。
iris_mean_by_species <- iris %>%
  group_by(Species) %>%
  summarise(across(everything(), mean))
iris_mean_by_species
# A tibble: 3 × 5
Species Sepal.Length Sepal.Width Petal.Length Petal.Width
<fct> <dbl> <dbl> <dbl> <dbl>
1 setosa 5.01 3.43 1.46 0.246
2 versicolor 5.94 2.77 4.26 1.33
3 virginica 6.59 2.97 5.55 2.03 iris_mean_by_species |>
ggplot(aes(x = Species, y = Sepal.Width, fill = Species)) +
geom_bar(stat = "identity") +
labs(title = "Mean Values by Species", x = "Species", y = "Mean Sepal.Width")
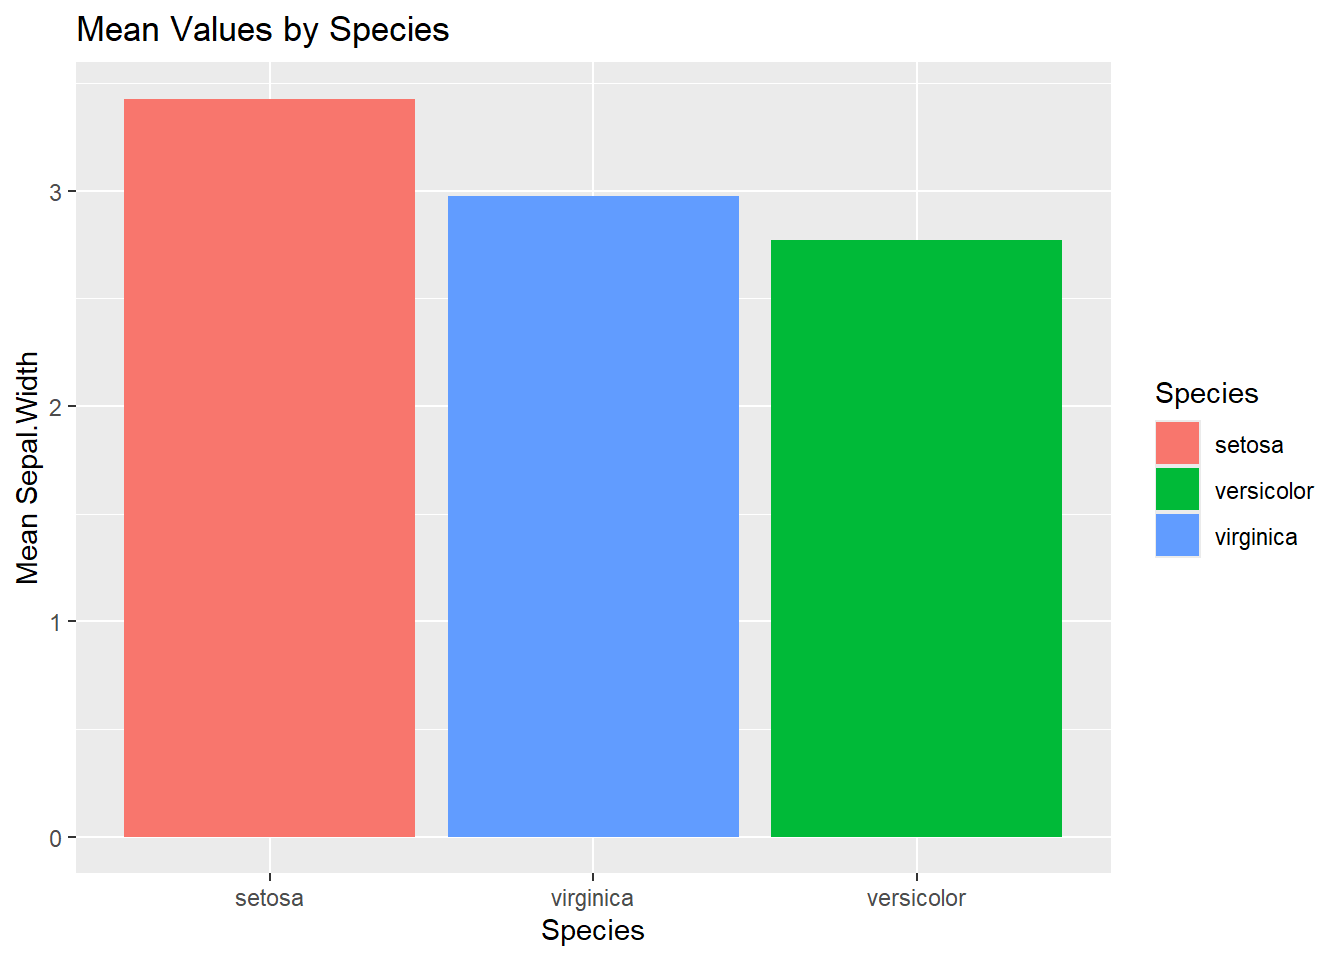
データを可視化した際、結果をSepal.Widthが大きい順(つまり、setosa、versicolor、virginicaの順)に並べたいとします。
まず、可視化するデータセットをSpela.Widthが大きい順に並べ替えた結果を表示してみます。結果は以下の通り、元の結果と変わりません。
iris_mean_by_species$Species[1] setosa versicolor virginica
Levels: setosa versicolor virginicadesc_iris_mean_by_species <- iris_mean_by_species |>
arrange(desc(Sepal.Width))
desc_iris_mean_by_species# A tibble: 3 × 5
Species Sepal.Length Sepal.Width Petal.Length Petal.Width
<fct> <dbl> <dbl> <dbl> <dbl>
1 setosa 5.01 3.43 1.46 0.246
2 virginica 6.59 2.97 5.55 2.03
3 versicolor 5.94 2.77 4.26 1.33 desc_iris_mean_by_species |>
ggplot(aes(x = Species, y = Sepal.Width, fill = Species)) +
geom_bar(stat = "identity") +
labs(title = "Mean Values by Species", x = "Species", y = "Mean Sepal.Width")
次に、iris_mean_by_speciesのSpeciesのlevelsをsetosa、virginica、verscolorの順番に変更します。その後、これまでと同様に棒グラフを作成すると、結果がSepal.Widthが大きい順番に表示されます。
levelsの変更に利用したfct_relevel関数は、forcatsパッケージの関数で指定した順番でlevelsを設定できます。なお、全ての要素を指定する必要はありません。(指定しなかった要素は後ろに回されます)
desc_iris_mean_by_species_2 <- iris_mean_by_species
desc_iris_mean_by_species_2$Species <- desc_iris_mean_by_species_2$Species |>
fct_relevel("setosa", "virginica")
desc_iris_mean_by_species_2# A tibble: 3 × 5
Species Sepal.Length Sepal.Width Petal.Length Petal.Width
<fct> <dbl> <dbl> <dbl> <dbl>
1 setosa 5.01 3.43 1.46 0.246
2 versicolor 5.94 2.77 4.26 1.33
3 virginica 6.59 2.97 5.55 2.03 desc_iris_mean_by_species_2 |>
ggplot(aes(x = Species, y = Sepal.Width, fill = Species)) +
geom_bar(stat = "identity") +
labs(title = "Mean Values by Species", x = "Species", y = "Mean Sepal.Width")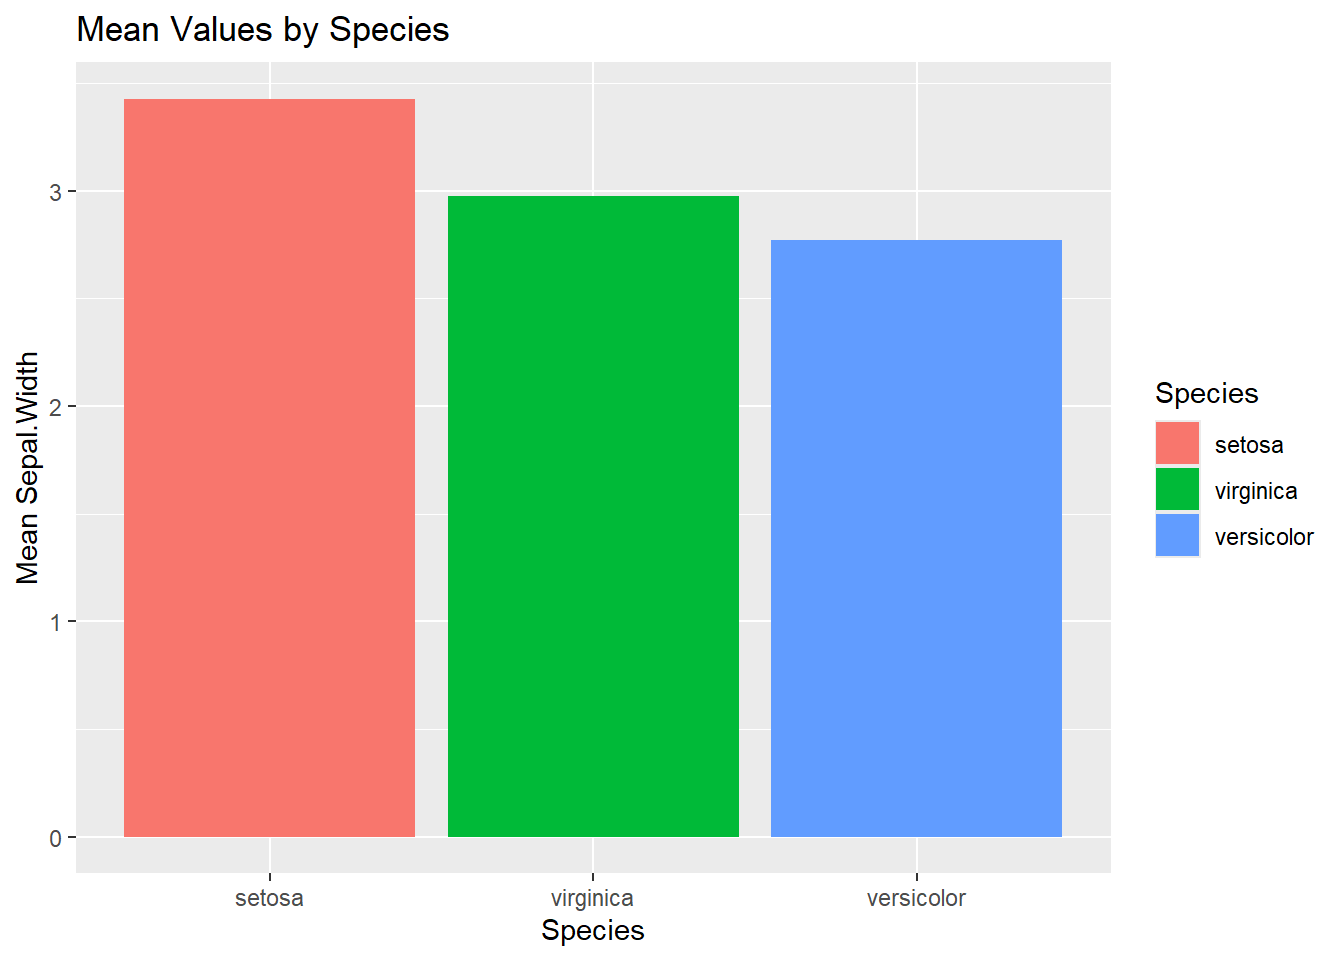
factor型のlevelsの順序を変更する関数
forcatsパッケージには、factor型のlevelsの順序を変更する関数が提供されています。以下で、いくつか利用例を示します。
fct_infreq関数は、登場頻度が多い要素の順番にlevelsを整理します。
f <- factor(c("c", "c", "a"))
f[1] c c a
Levels: a cfct_infreq(f)[1] c c a
Levels: c afct_inorder関数は、要素の登場した順番でlevelsを整理します。
f <- factor(c("b", "a"))
f[1] b a
Levels: a bfct_inorder(f)[1] b a
Levels: b afct_rev関数は、levelsを反転させます。
f <- factor(c("a", "b", "c"))
f[1] a b c
Levels: a b cfct_rev(f)[1] a b c
Levels: c b afct_shift関数は、levelsをずらします。デフォルトでは、levelsが1つ左にずれます(最初のlevelsは最後に回ります)が、引数で指定することで、ずれる大きさを変更可能です。また、引数に負の値を指定した場合は右にずれます。
f <- factor(c("a", "b", "c", "d"))
f[1] a b c d
Levels: a b c dfct_shift(f)[1] a b c d
Levels: b c d afct_shift(f, 2)[1] a b c d
Levels: c d a bfct_shift(f, -1)[1] a b c d
Levels: d a b cfct_reorder関数は、他の変数を使って、levelsを並べ替えることが可能です。
factor型の活用方法で実施した「Sepal.Widthの平均値が大きい順に並べ替える」対応をfct_reorder関数で実施するには、以下のように記載します。
fct_reorder(Species, Sepal.Width, .fun = mean, .desc = TRUE)は、SpeciesのlevelsをSepal.Widthの平均値で変更しています。デフォルトは昇順ですが、「.desc = TRUE」と指定すると降順となります。
iris_mean_by_species |>
  ggplot(aes(x = Species, y = Sepal.Width, fill = Species)) +
  geom_bar(stat = "identity") +
  labs(title = "Mean Values by Species", x = "Species", y = "Mean Sepal.Width")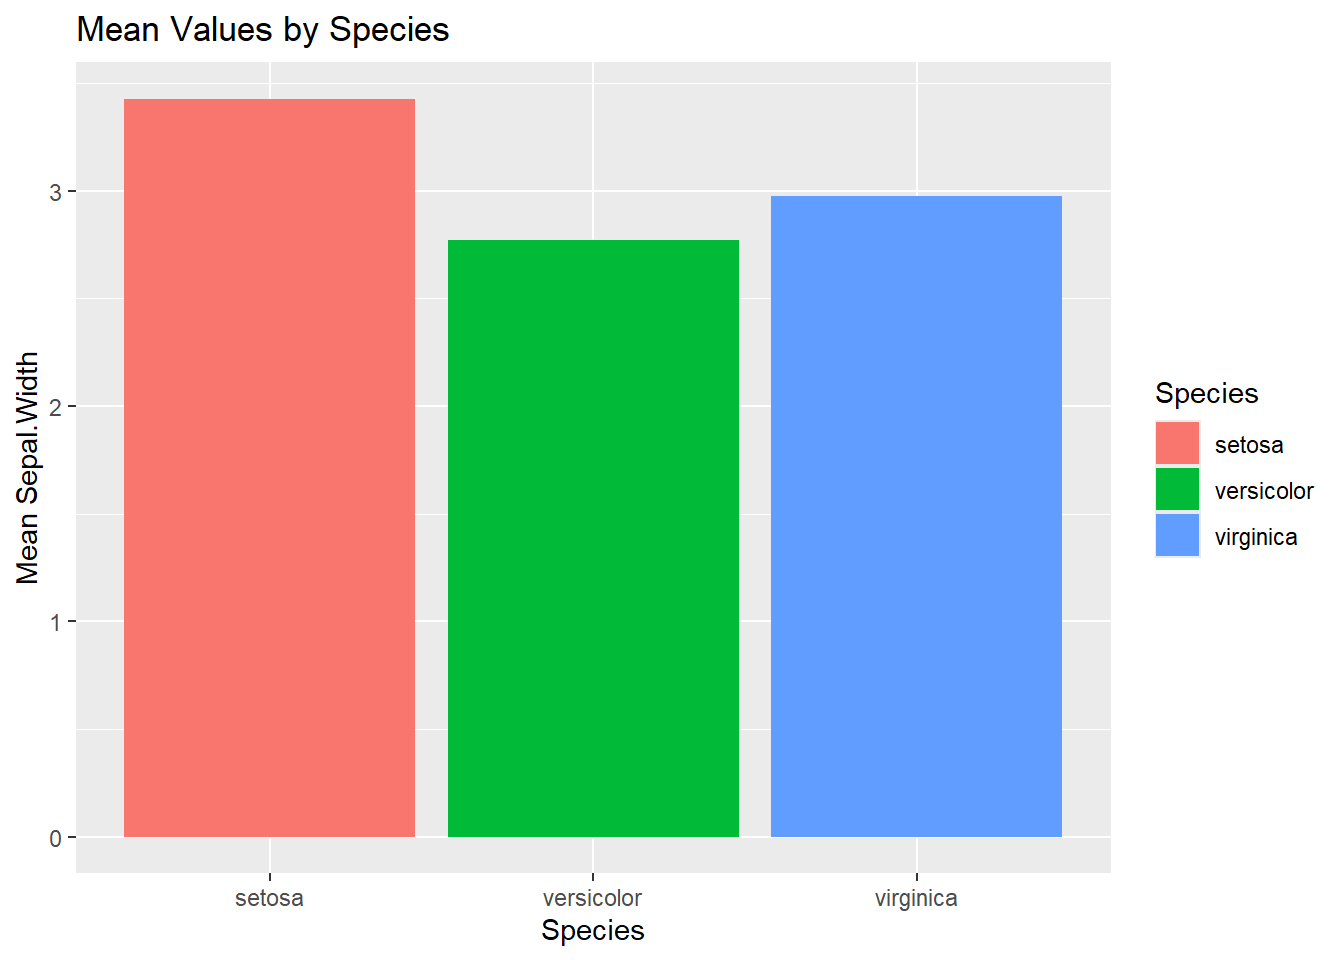
iris_mean_by_species |>
  ggplot(aes(x = fct_reorder(Species, Sepal.Width, .fun = mean, .desc = TRUE), y = Sepal.Width, fill = Species)) +
  geom_bar(stat = "identity") +
  labs(title = "Mean Values by Species", x = "Species", y = "Mean Sepal.Width")